Learning SSRS

SQL Server Reporting Services, shortly called as SSRS is one of the trending reporting tool in the market. Although it is the most powerful reporting tool, it is quite easy to learn.
SSRS is a sever based reporting platform used to create and manage tabular, matrix, graphical, charts, and free-form reports. The reports that we create can be accessed and managed over a world wide connection.
You cannot learn SSRS by merely reading this blog. you have to practice every chart or report by yourself. If you practice multiple times you can master this reporting tool. So first download and install SQL Server and also install BIDS or any SQL Data Tools.

Installation guide for BIDS
Download and install BIDS. When the software is done downloading, right click on it and run as administrator.
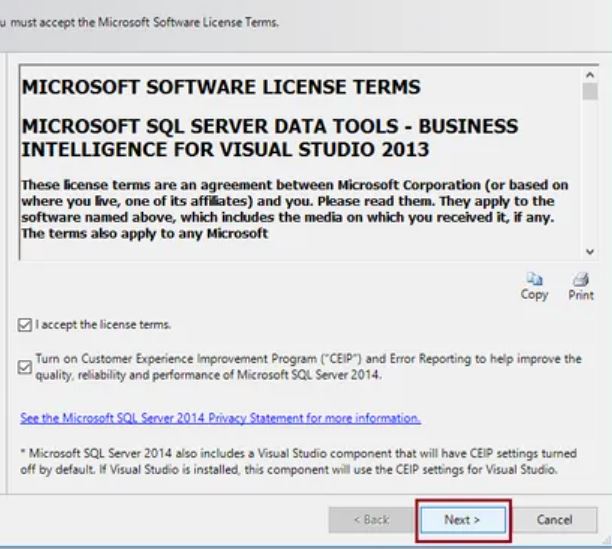
It takes you to a license page as shown below, ensure you check both boxes before you click on the next button.
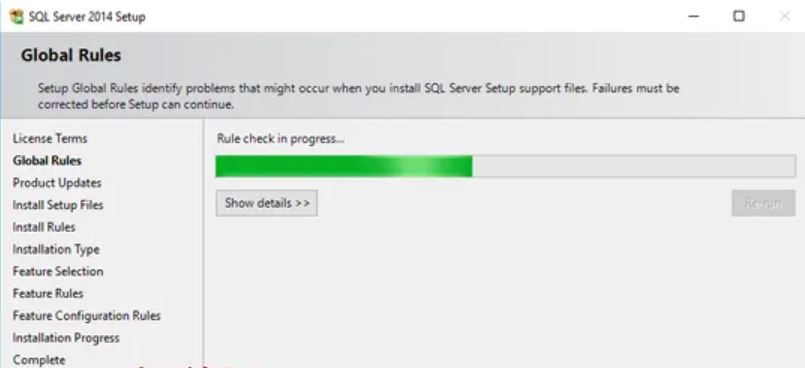
 Next the application would look for global rules as shown below. If you find any errors, try to Re-run.
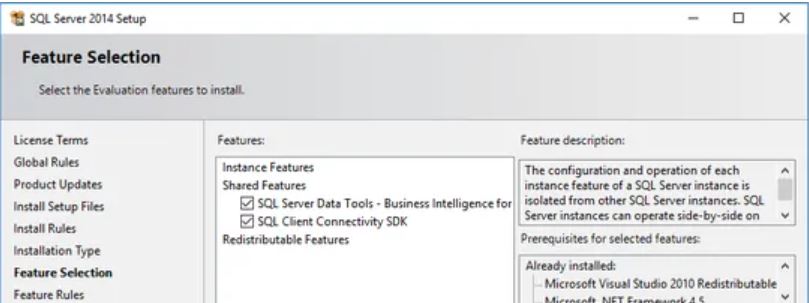
 In the next screen select both SQL Server Data Tools - Business Intelligence for visual studio 2013 and also SQL Client connectivity SDK, after which click the next button.
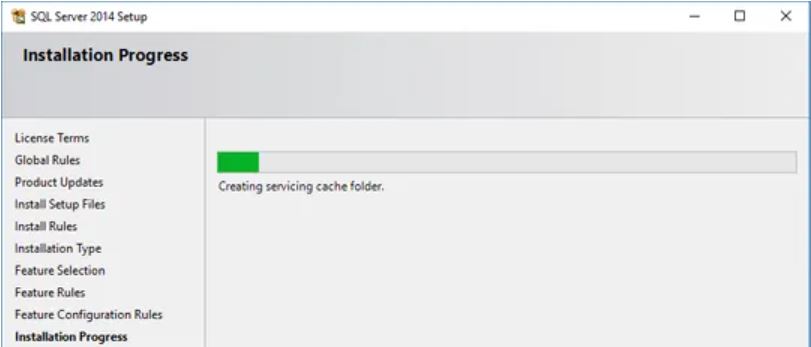
 Once you click the next button, the installation process will start.
Once the installation process completes, your SQL Server 2014 has been successfully installed. The product updates window will be displayed. Click on the close button and start working with SQL Server data tools.
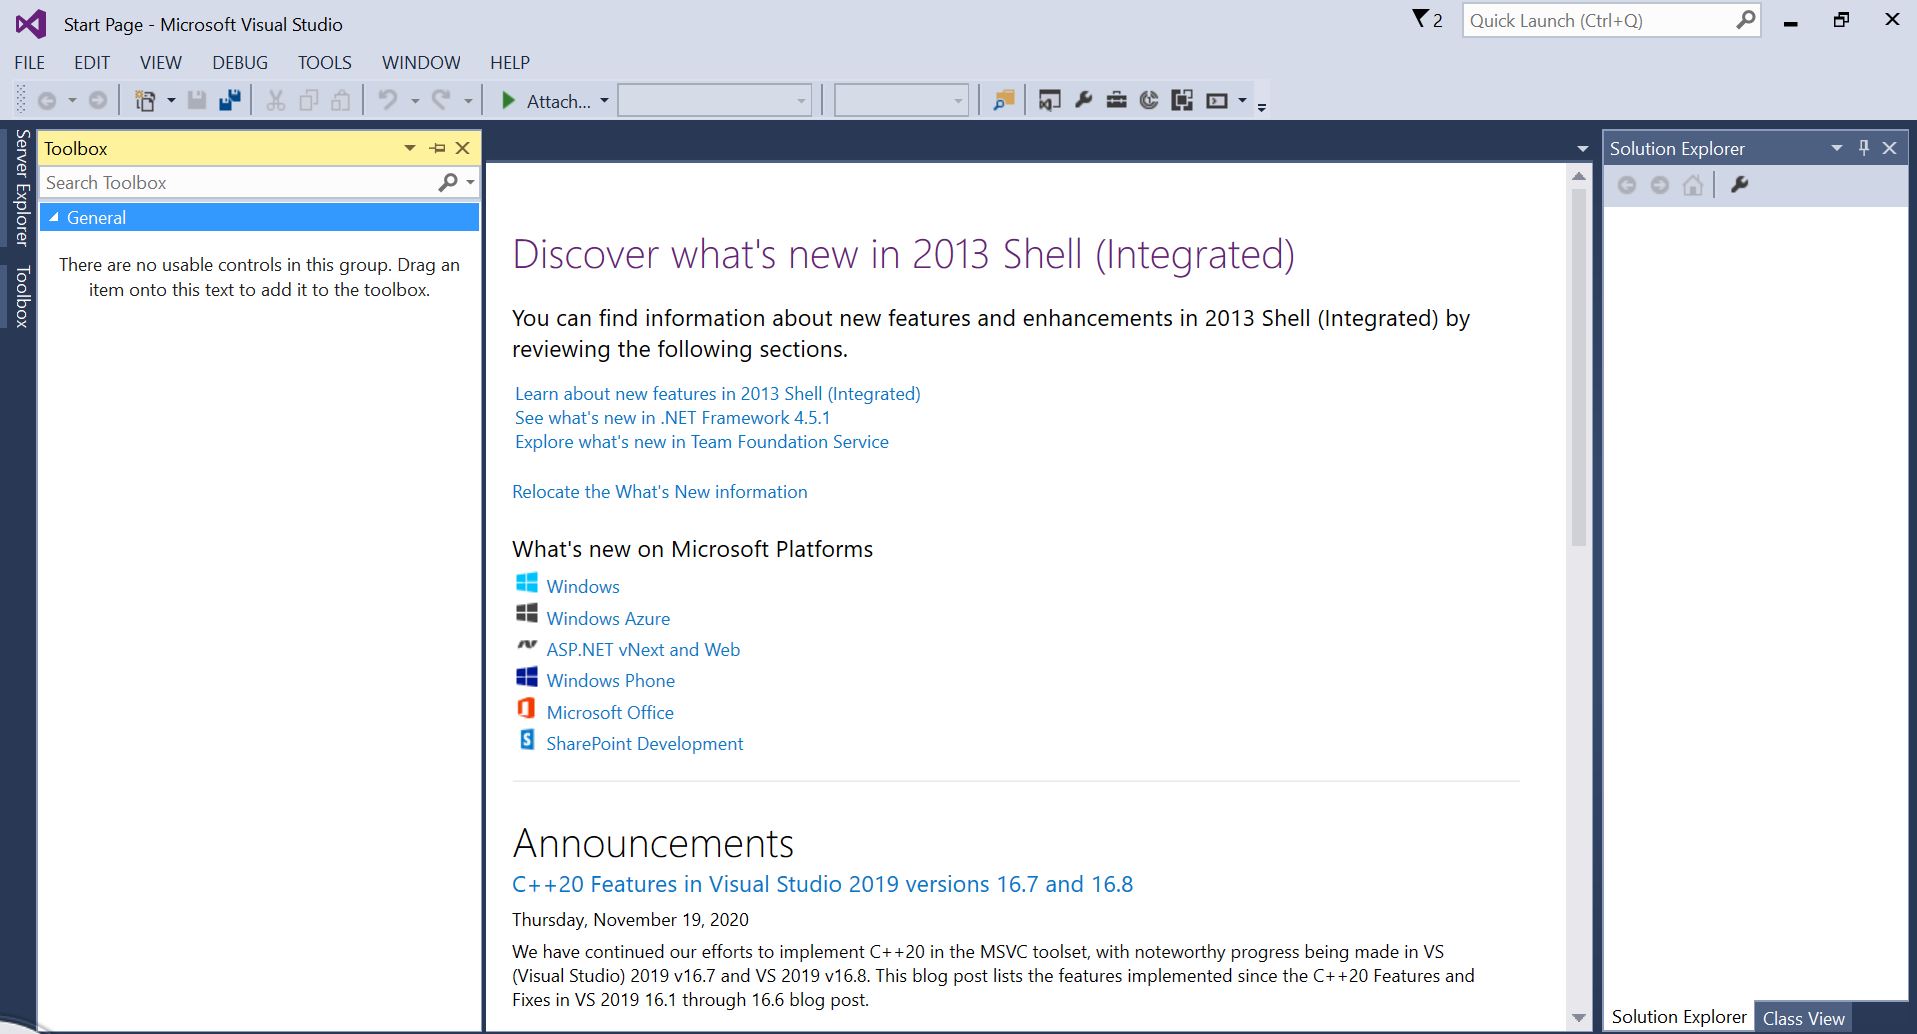
The application would look like this when open
How to create a new project in SSRS
Open your SQL Server data tools, then select the file option from the Menu item. Please select New and then select project option for creating new SSRS Project.
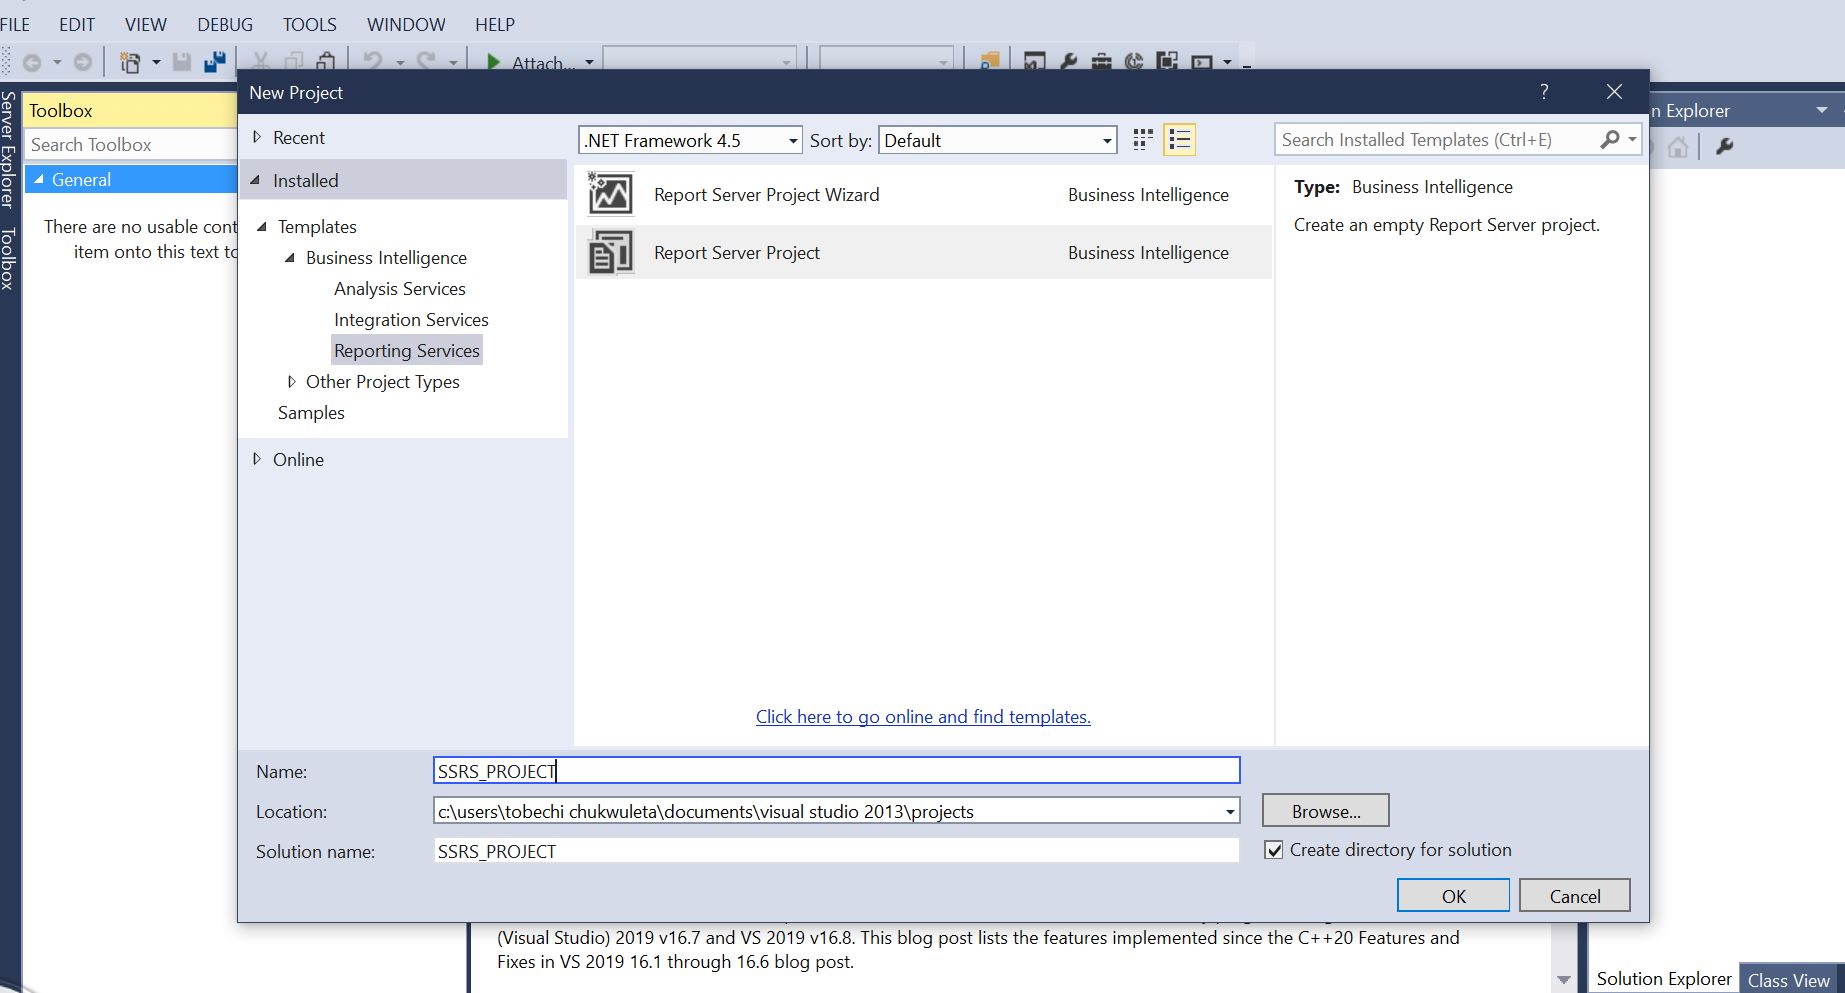
Once you click on the new project option, it will open new project window to choose the required project from available project templates. Ensure you select Reporting Services under Business Intelligence and also select Report Server Project as seen below. Below, give your report a name, and once done, click 'OK'
Once done, a new interface would load, as seen below.
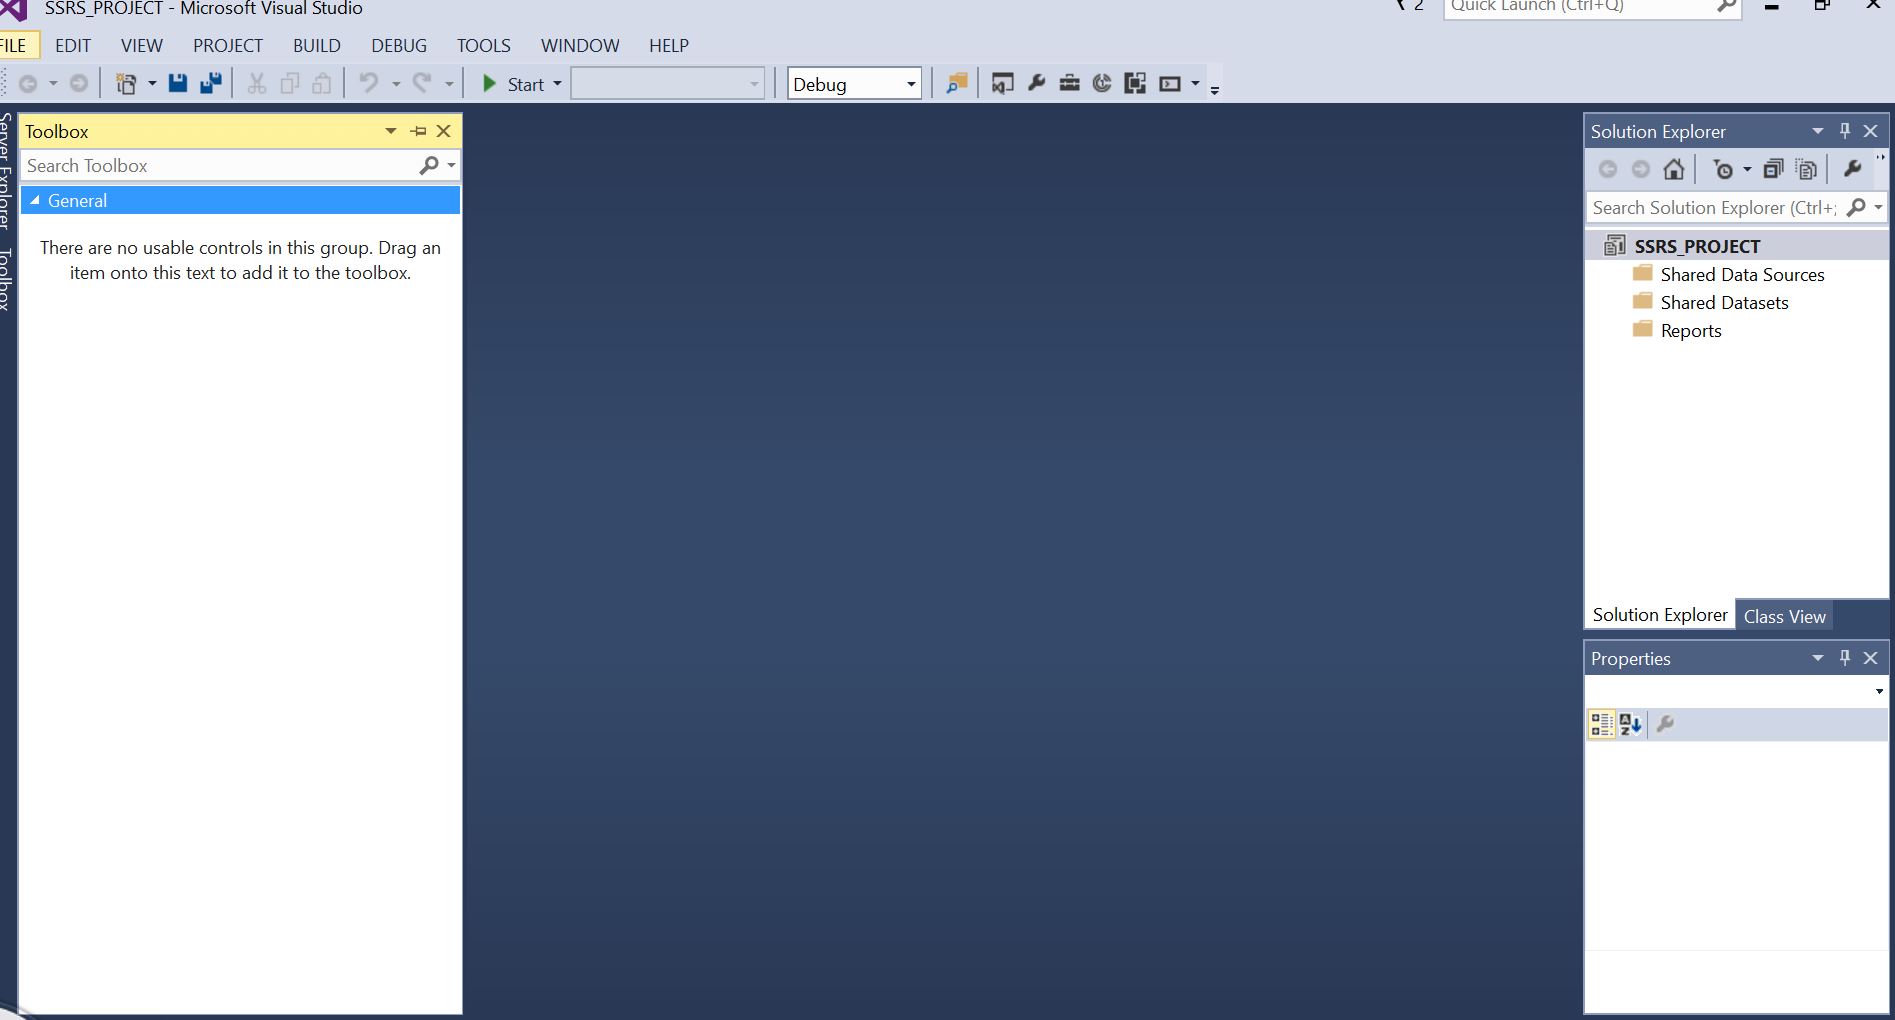
Now, if you look at the Solution Explorer, you can understand the solution name and project name. From the above screenshot, you can observe that we have three (3) folders under the SSRS New project.
- Shared Data Sources: In SSRS, Data Source (DS) is a connection setting that is used to connect with underlying Database or Data Warehouse. The SSRS supports two types of data sources, Shared data source and Embedded data source. Shared data source is used to share the same data source for multiple reports, report models, and subscriptions. It can be created once and used in multiple reports. If you want to change the data source, you can do it at one place and it will reflect in all the supporting reports.
Creating SSRS Shared Data Source
To create a shared data source, right click on the shared data source folder present in the solution explorer and select the Add new data source from the context menu or you can choose the add option and then select new item option from the context menu. Here we have selected the Add new data source option. Once you click on that option, it will open the shared data source properties window to configure the SSRS shared data source. In the name tab, specify a valid unique name for the data source you want to create, select also the connection type from the drop down list. If your data source is SQL Server then select Microsoft SQL Server or OLE DB, if your data source is SQL Server analysis service, then select Microsoft SQL Server Analysis, etc. If you know how to write the connection string then write it down in the text area provided in the connection string segment. If not click on the edit button to specify the Data source (provider), server name, login credentials, and database name.
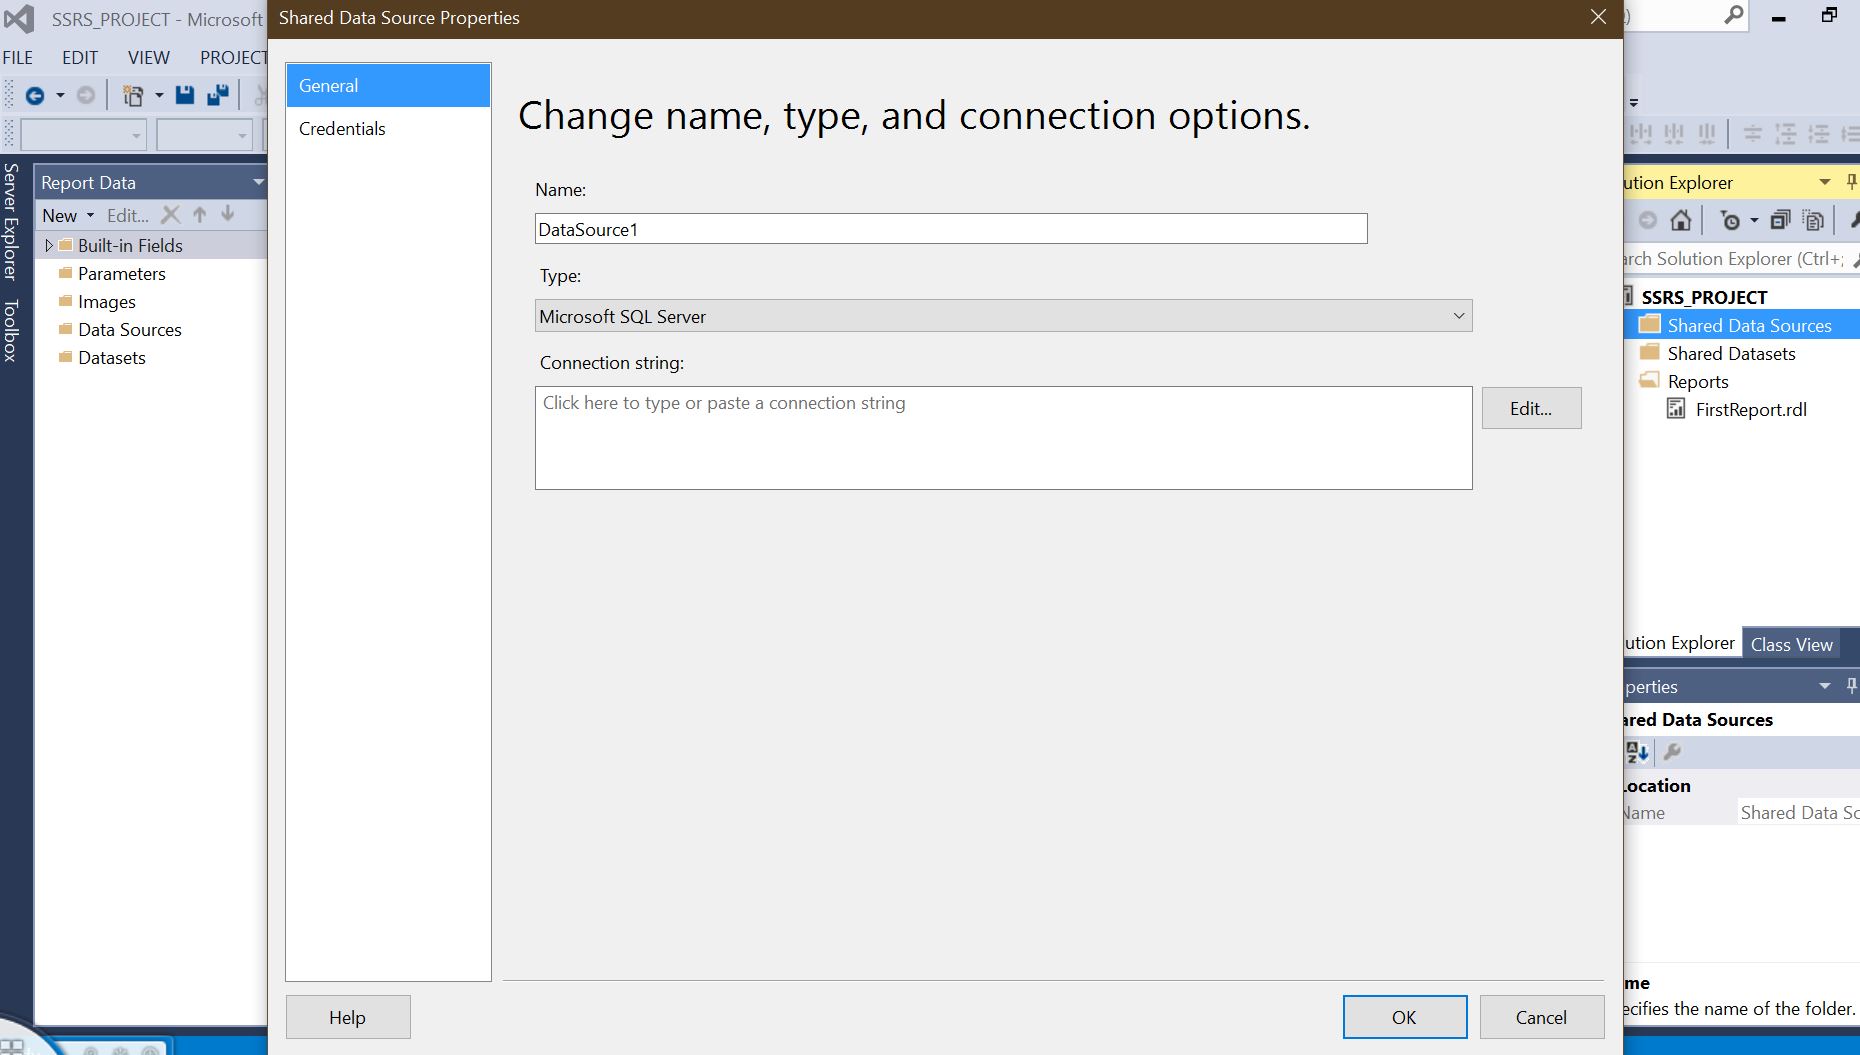
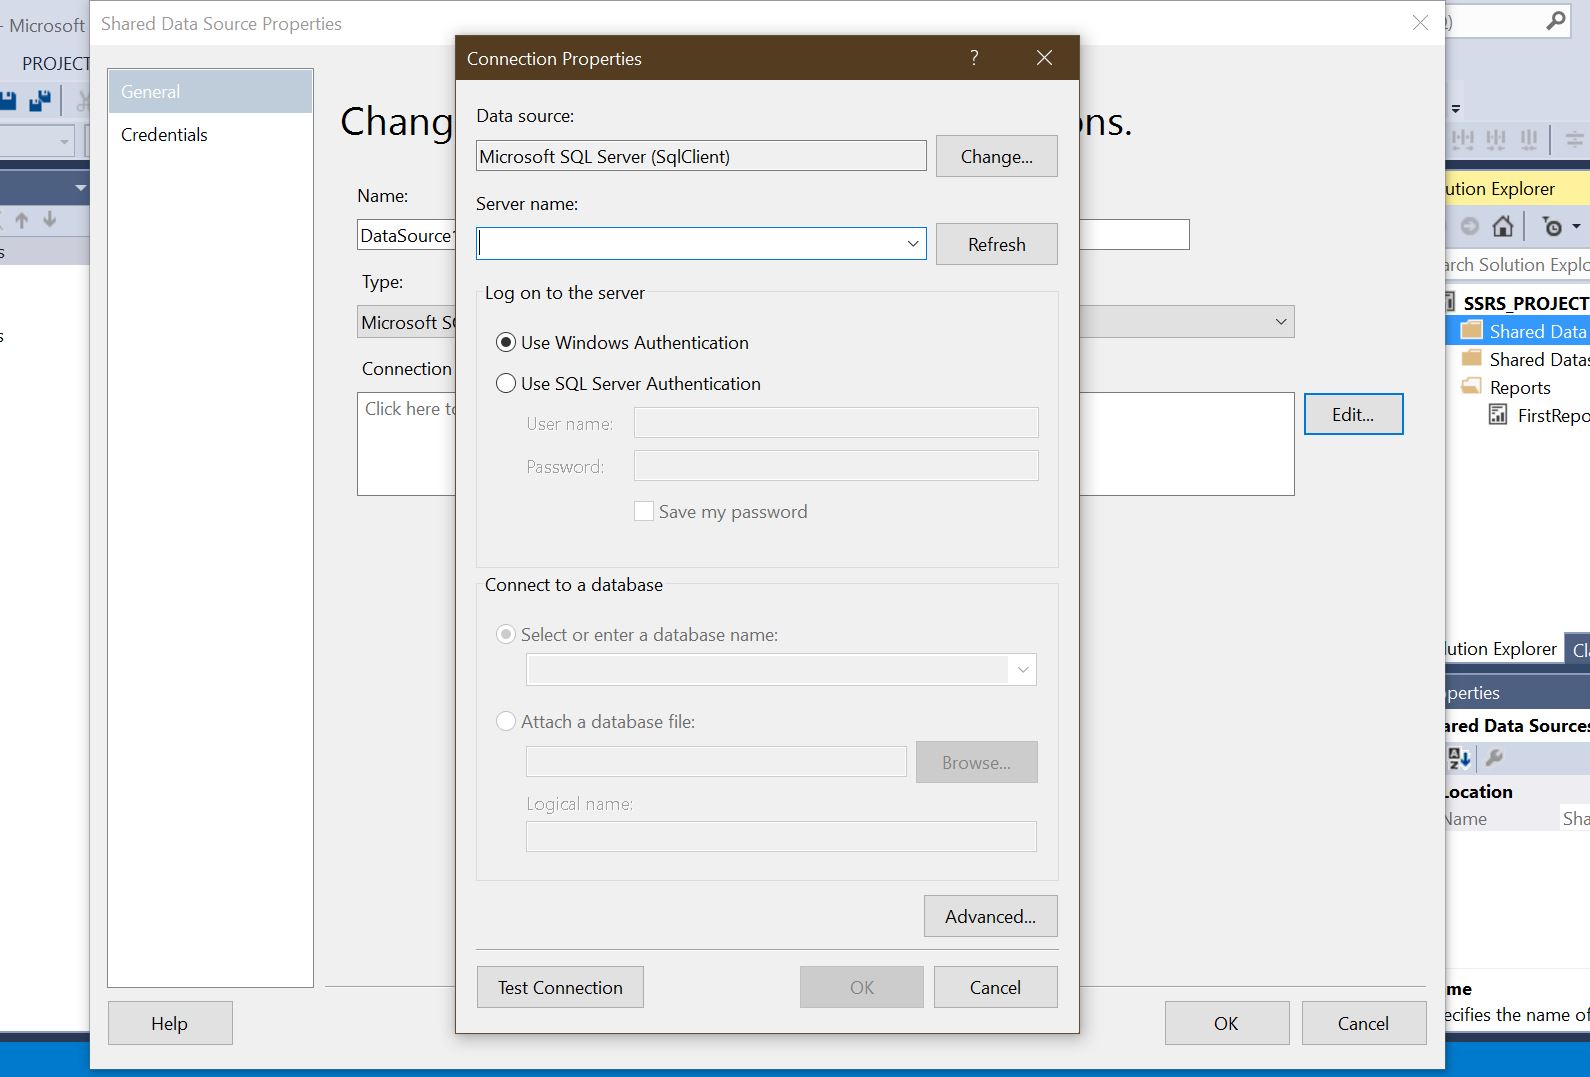
In this SSRS shared data source example, we have the data source section which determines which server we are retrieving this data from, in this case we are retrieving data from SQL Server so we select the Microsoft SQL Server (SQLClient), you can change the name as per your requirement. Specify the server name you used in installing SQL Server in the server name section and also specify how you want to log into SQL Server. For now, we are using windows authentication.
In the 'connect to a database' segment, choose the select or enter a database name and also for this example we are using AdventureWorks database. Click on the Test Connection button provided below to check whether the connection is successful or not, afterwards click Ok to finish configuring the connection properties.
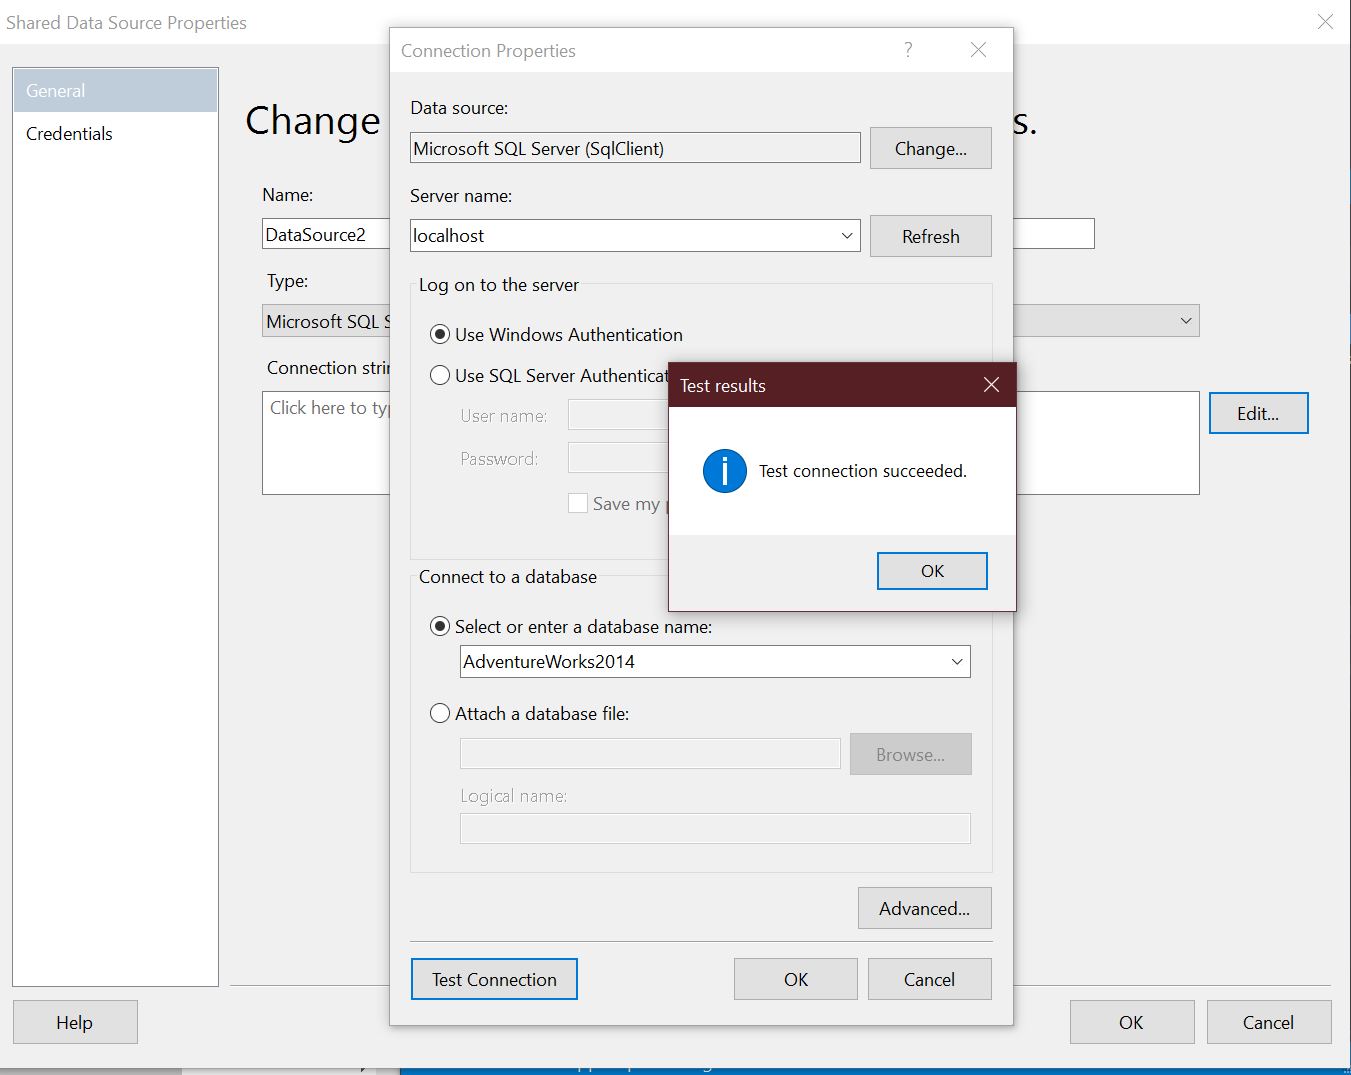
Check the solution explorer, you database should now be included under shared datasets.
- Shared Datasets: In SSRS, Dataset is an SQL Command used to retrieve the data from Data source for report creation. Dataset consists of SQL Command, parameters, filters, etc. SSRS supports two types of datasets: Shared dataset and Embedded dataset. Shared dataset is used to share the same dataset with multiple reports. It can be created once and used in multiple reports. If you want to change the dataset, you can do it at one place and it will reflect in all the supporting reports.
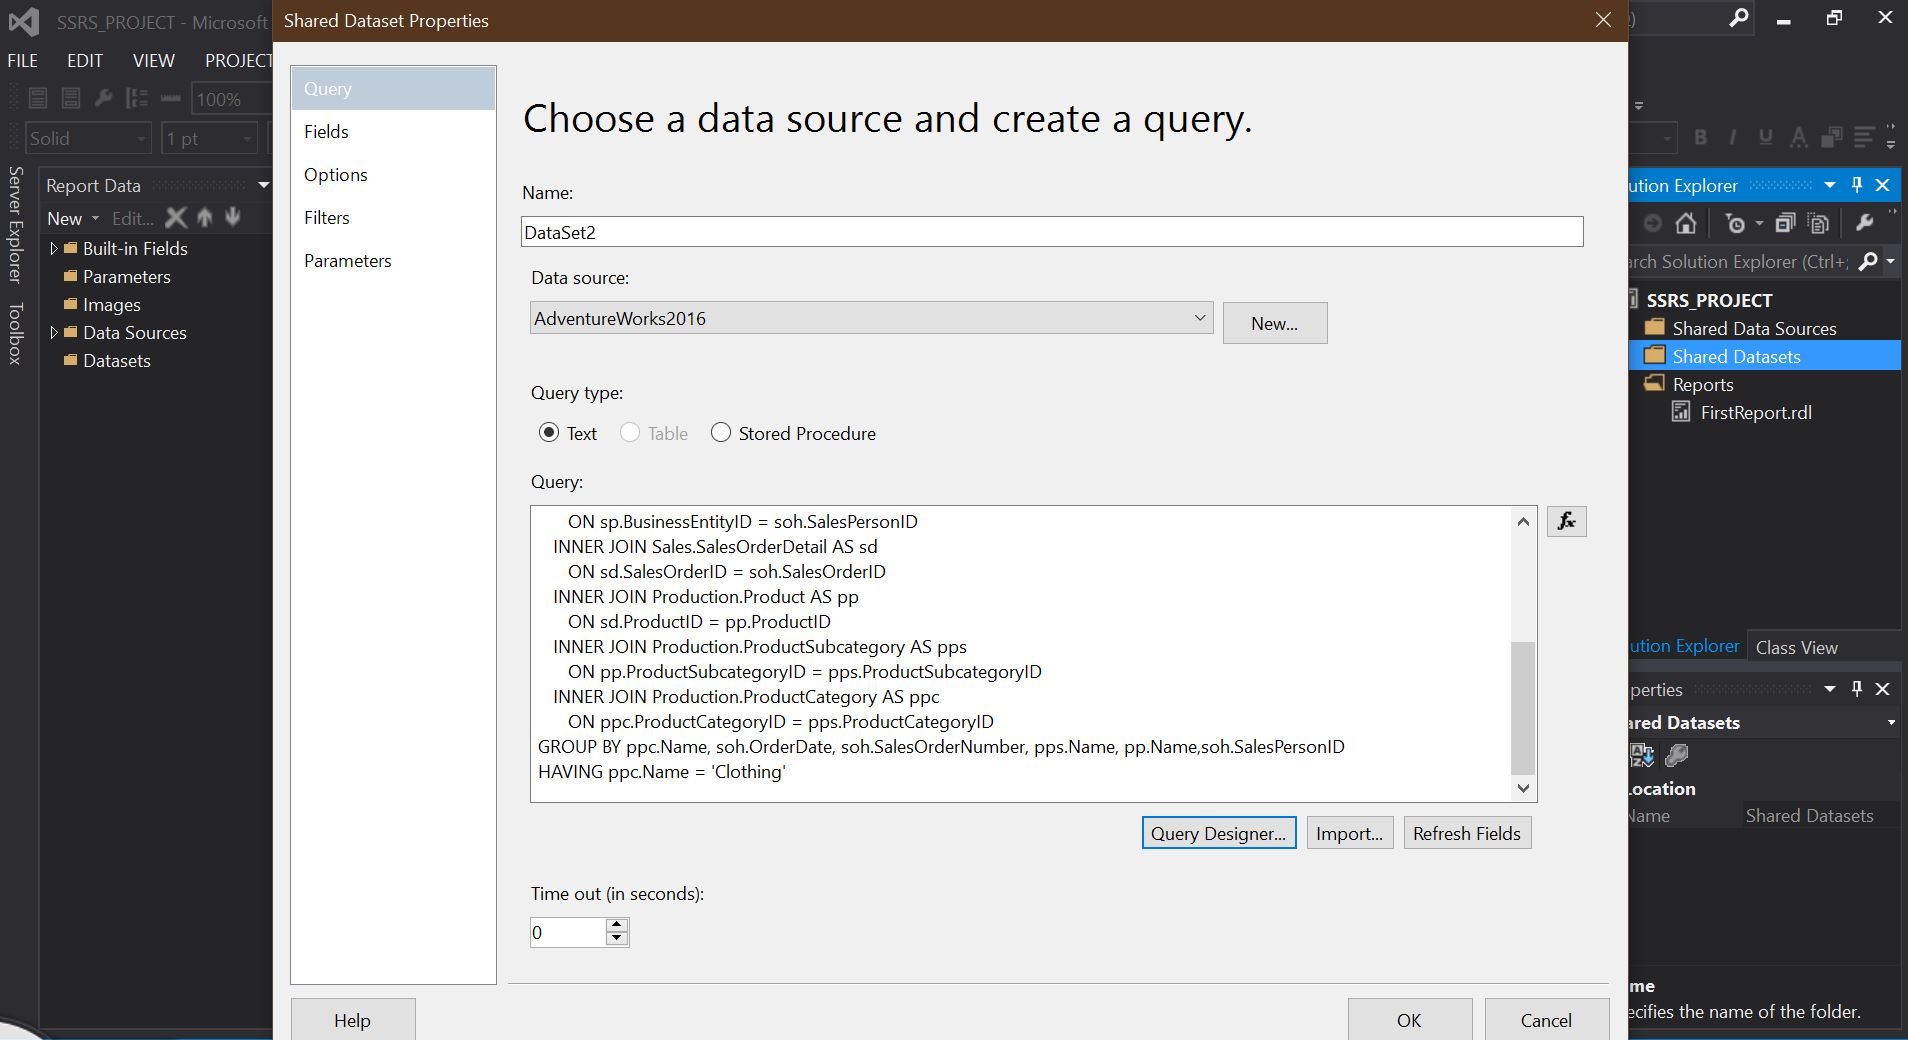
To create a shared dataset in SSRS, right click on the shared dataset folder present in the solution explorer. Select the add new dataset option from the context menu and choose or select the new item option from the context menu. It would then open a new window and from that window you can select the New dataset option. Once it opens specify a valid unique name for the dataset you want to create. Since we have already created a database, we can select the AdventureWorks for data source or select another data source from the dropdown, in this case I am using AdventureWorks2016. The query type allows us choose from 3 options; text, table and stored procedure. If you don't know how to write the SQL queries, you can select query designer, it allows you to design a using a GUI. Time out allows you to specify the query execution time in seconds. From the below, observe that we are selecting the text type, we are using a dataset embedded in my report radio button, and the query we would be using is:
SELECT
   soh.OrderDate AS [Date],
   soh.SalesOrderNumber AS [Order],
   pps.Name AS [Subcat],
   pp.Name as [Product],
   SUM(sd.OrderQty) AS [Qty],
   SUM(sd.LineTotal) AS [LineTotal]
FROM Sales.SalesPerson sp
INNER JOIN Sales.SalesOrderHeader AS soh
      ON sp.BusinessEntityID = soh.SalesPersonID
   INNER JOIN Sales.SalesOrderDetail AS sd
      ON sd.SalesOrderID = soh.SalesOrderID
   INNER JOIN Production.Product AS pp
      ON sd.ProductID = pp.ProductID
   INNER JOIN Production.ProductSubcategory AS pps
      ON pp.ProductSubcategoryID = pps.ProductSubcategoryID
   INNER JOIN Production.ProductCategory AS ppc
      ON ppc.ProductCategoryID = pps.ProductCategoryID
GROUP BY ppc.Name, soh.OrderDate, soh.SalesOrderNumber, pps.Name, pp.Name,soh.SalesPersonID
HAVING ppc.Name = 'Clothing'
(Optional) Select the Query designer button. The query is displayed in the text-based query designer. View the result of the query by selecting the (!) run button on the query designer toolbar.
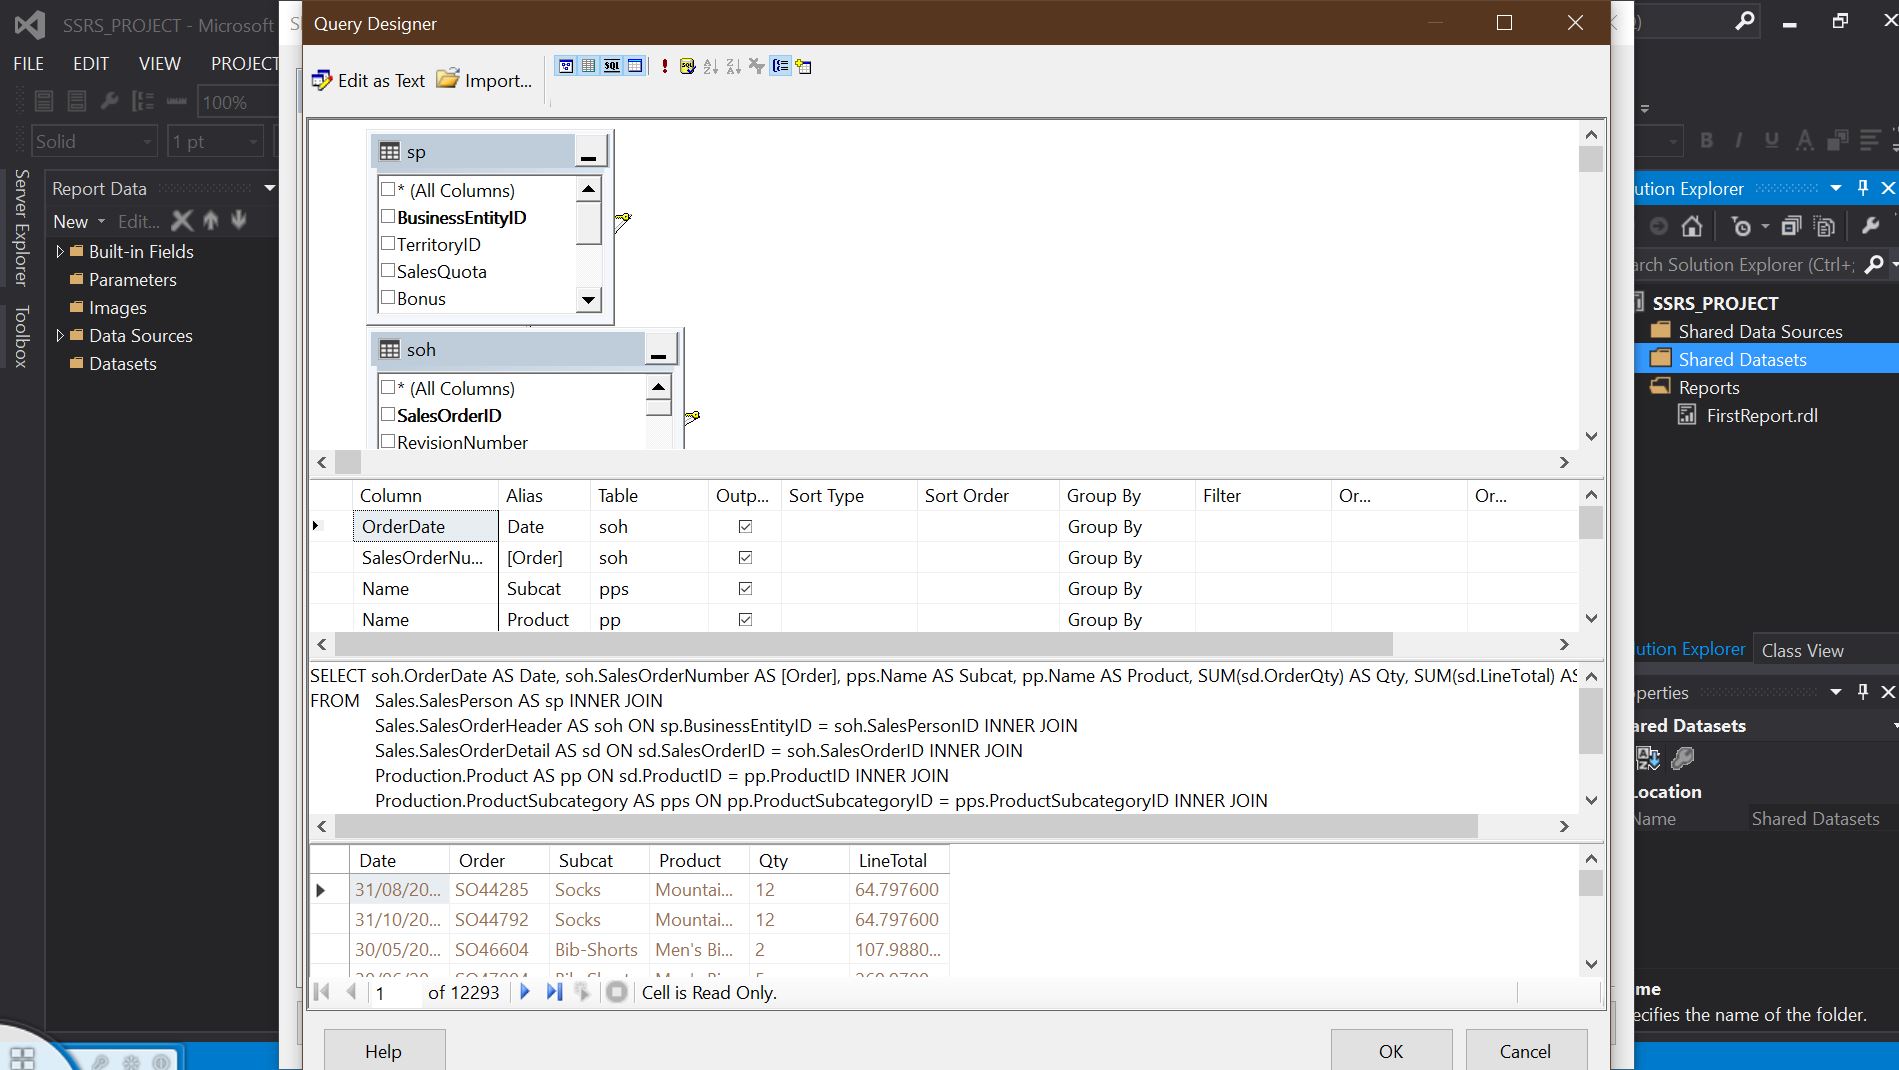
Select Ok to exit the Query Designer and select Ok to exit the dataset properties dialog box
- Reports: This folder is used to create SSRS reports.
Creating a new Report in SSRS
SSRS Report creation can be done either using report wizard or normal mode.
Creating SSRS Report using wizard
Let's see how we can create SSRS Report using wizard. We would talk about the second later in this article.
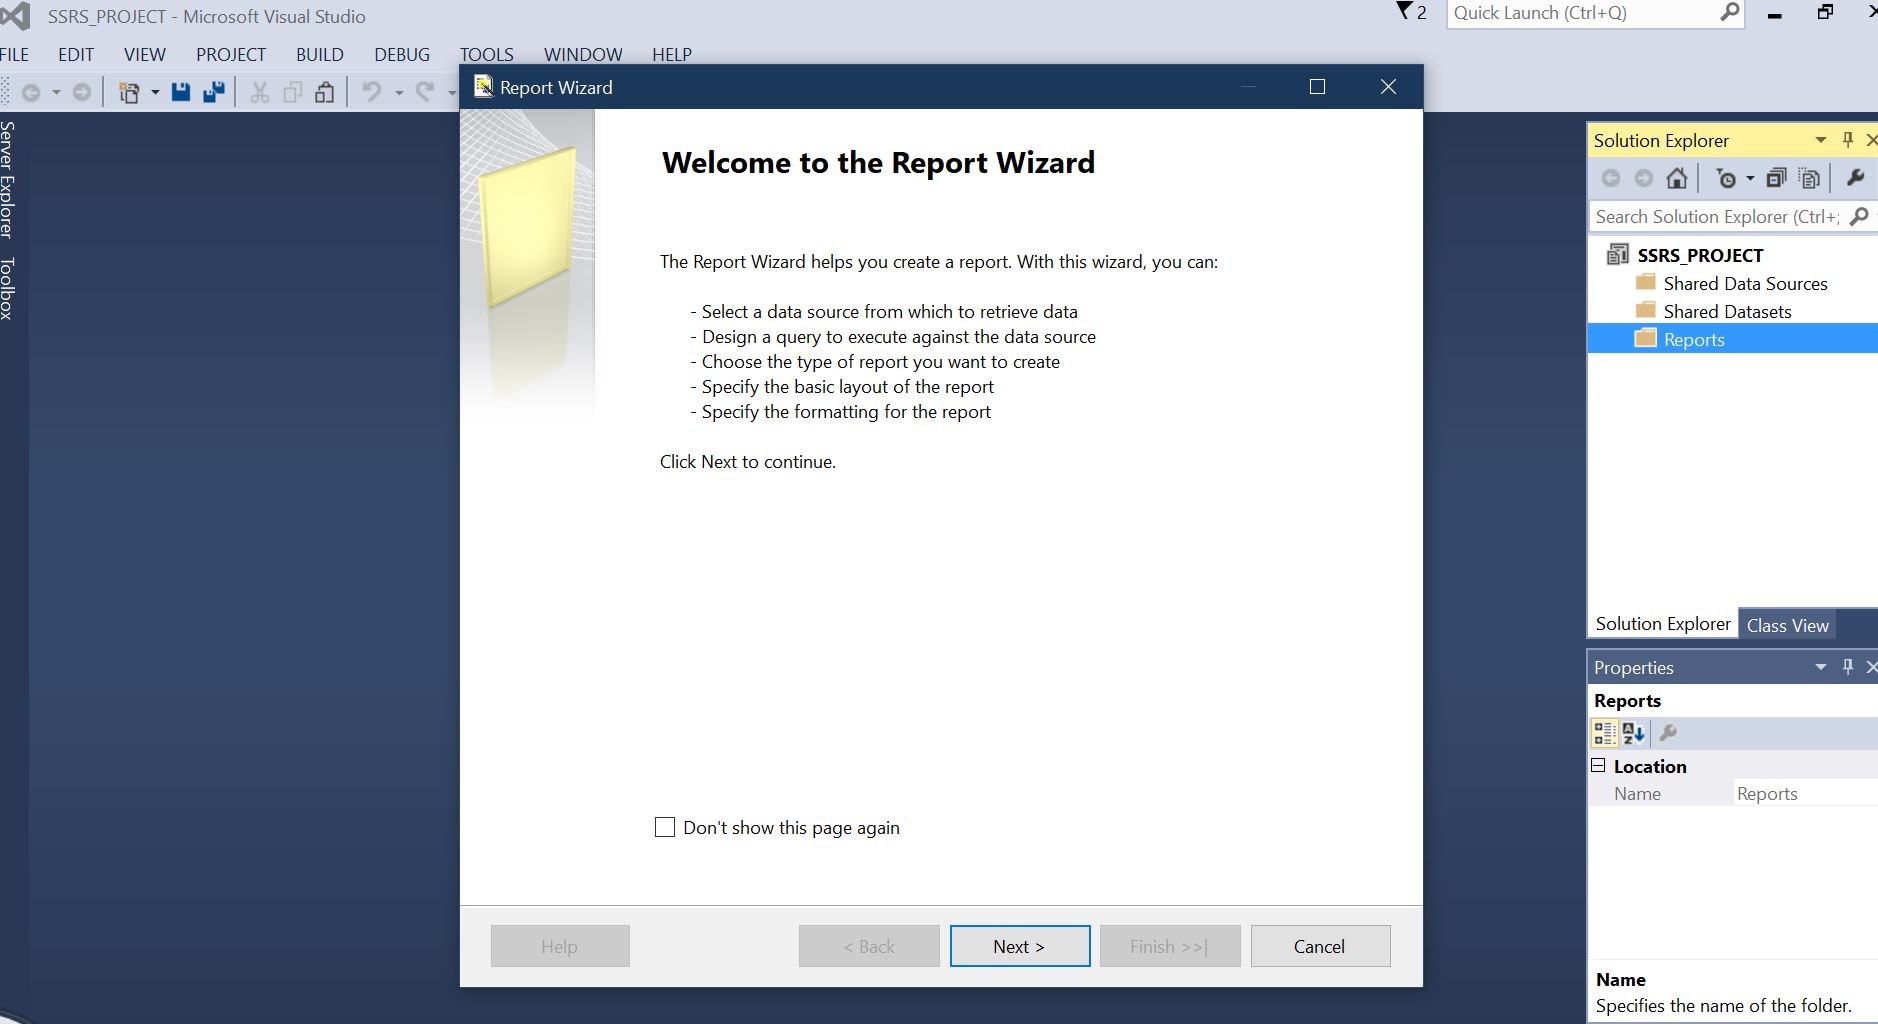
Right-click on the report folder, a context menu would open, select the first option, 'Add New Report'. Once you click on the Add New Report option, it opens the report wizard as seen below. It explains the different functions that a report wizard can do in relation to creating reports.
Create SSRS without using Wizard
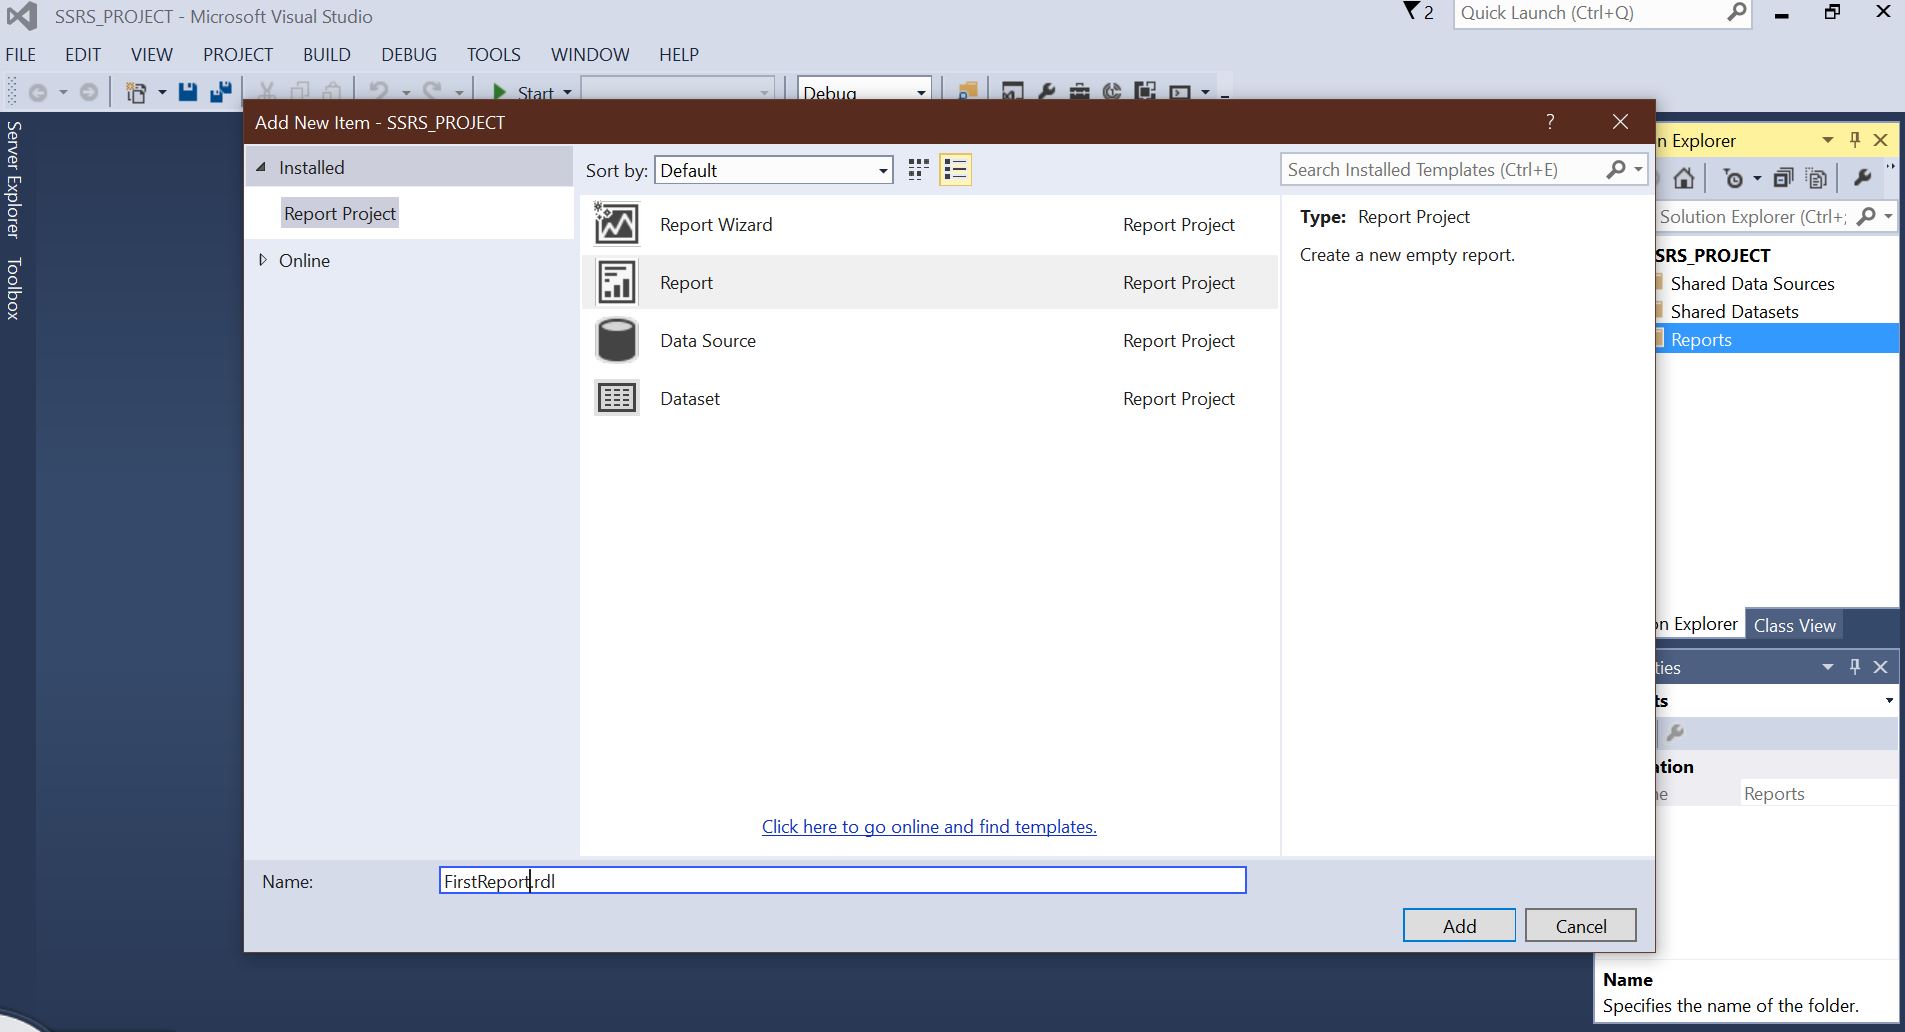
In general, we don't use the report wizard to generate any report. To create a report without using the wizard, Right click on the reports folder under the Solution Explorer section, select new item, which then opens the Add new Item window with all the available option. Please select the report option and rename it as to what you choose. See the screenshot below for reference.
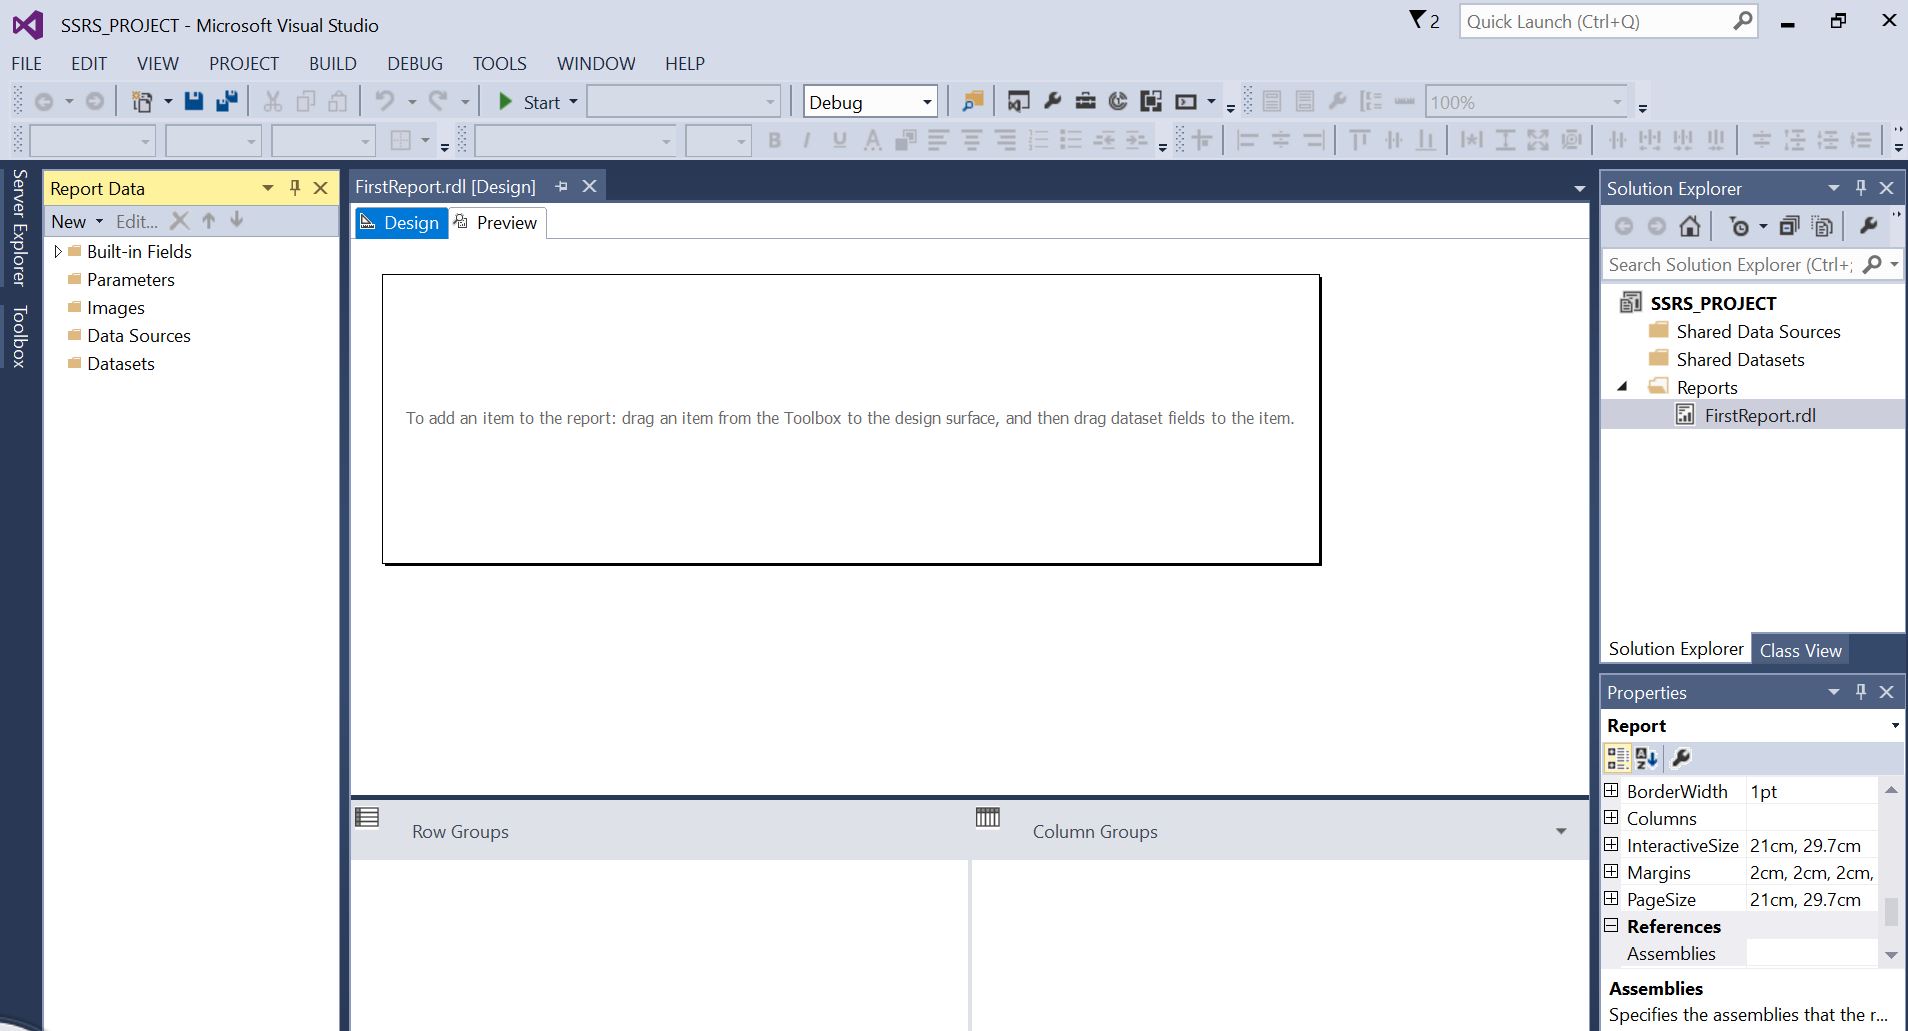
Once you click on the Add button, a new SSRS report with the specified name will generate as seen above. If you observe the Report Data pane, we have 5 different folders:
- Built-in fields: These are built-fields available in SSRS. You can use these items to show the page number, language, report title etc.
- Parameters: The report parameters enables the users to filter the SSRS reports dynamically. It allows the user to enter a specific value in the textbox and then SSRS will filter the report data using the user-specified value.
- Images: This is used to add images to the report.
- Data sources: This folder is used to create an embedded data source
- Datasets: This folder is used to create an embedded dataset.
Adding a table to the report (Reporting services)
After you define the dataset, you can start designing the paginated report. You can create a report layout by dragging and dropping report objects from the toolbox pane to the design surface. Some of report object types include: table, text box, image, line, rectangle, chart, map, etc. Drag and drop a table from the SSRS toolbox to the data region. In this example, we are using the already created data source and dataset. We can add column names to the SSRS Table report in two ways:
- We can drag the column name from report data to the table column.
- When we click on a particular cell, it will open the context menu displaying available column names in that dataset. We can select the required column from the list.
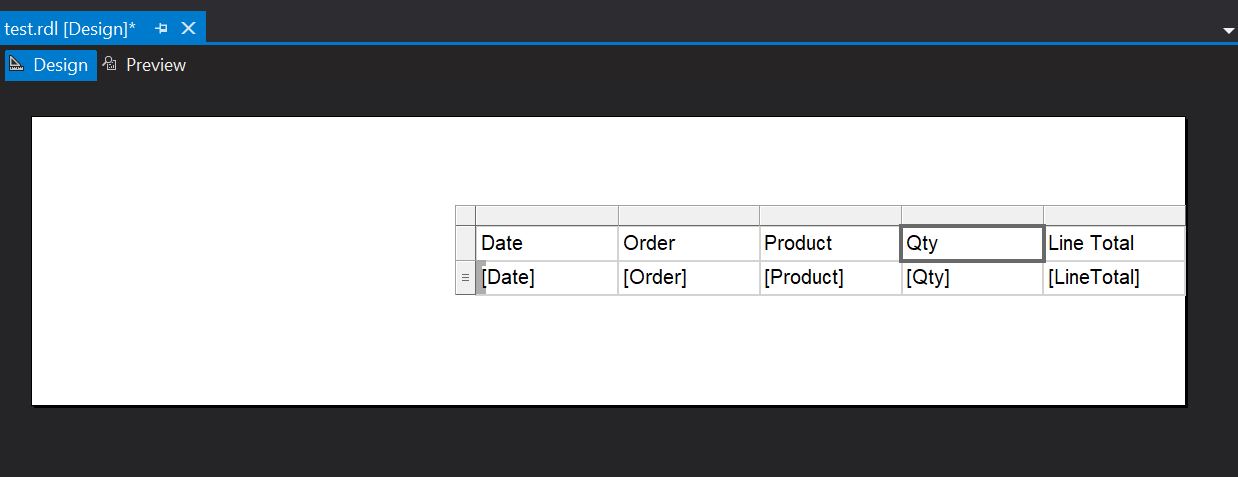
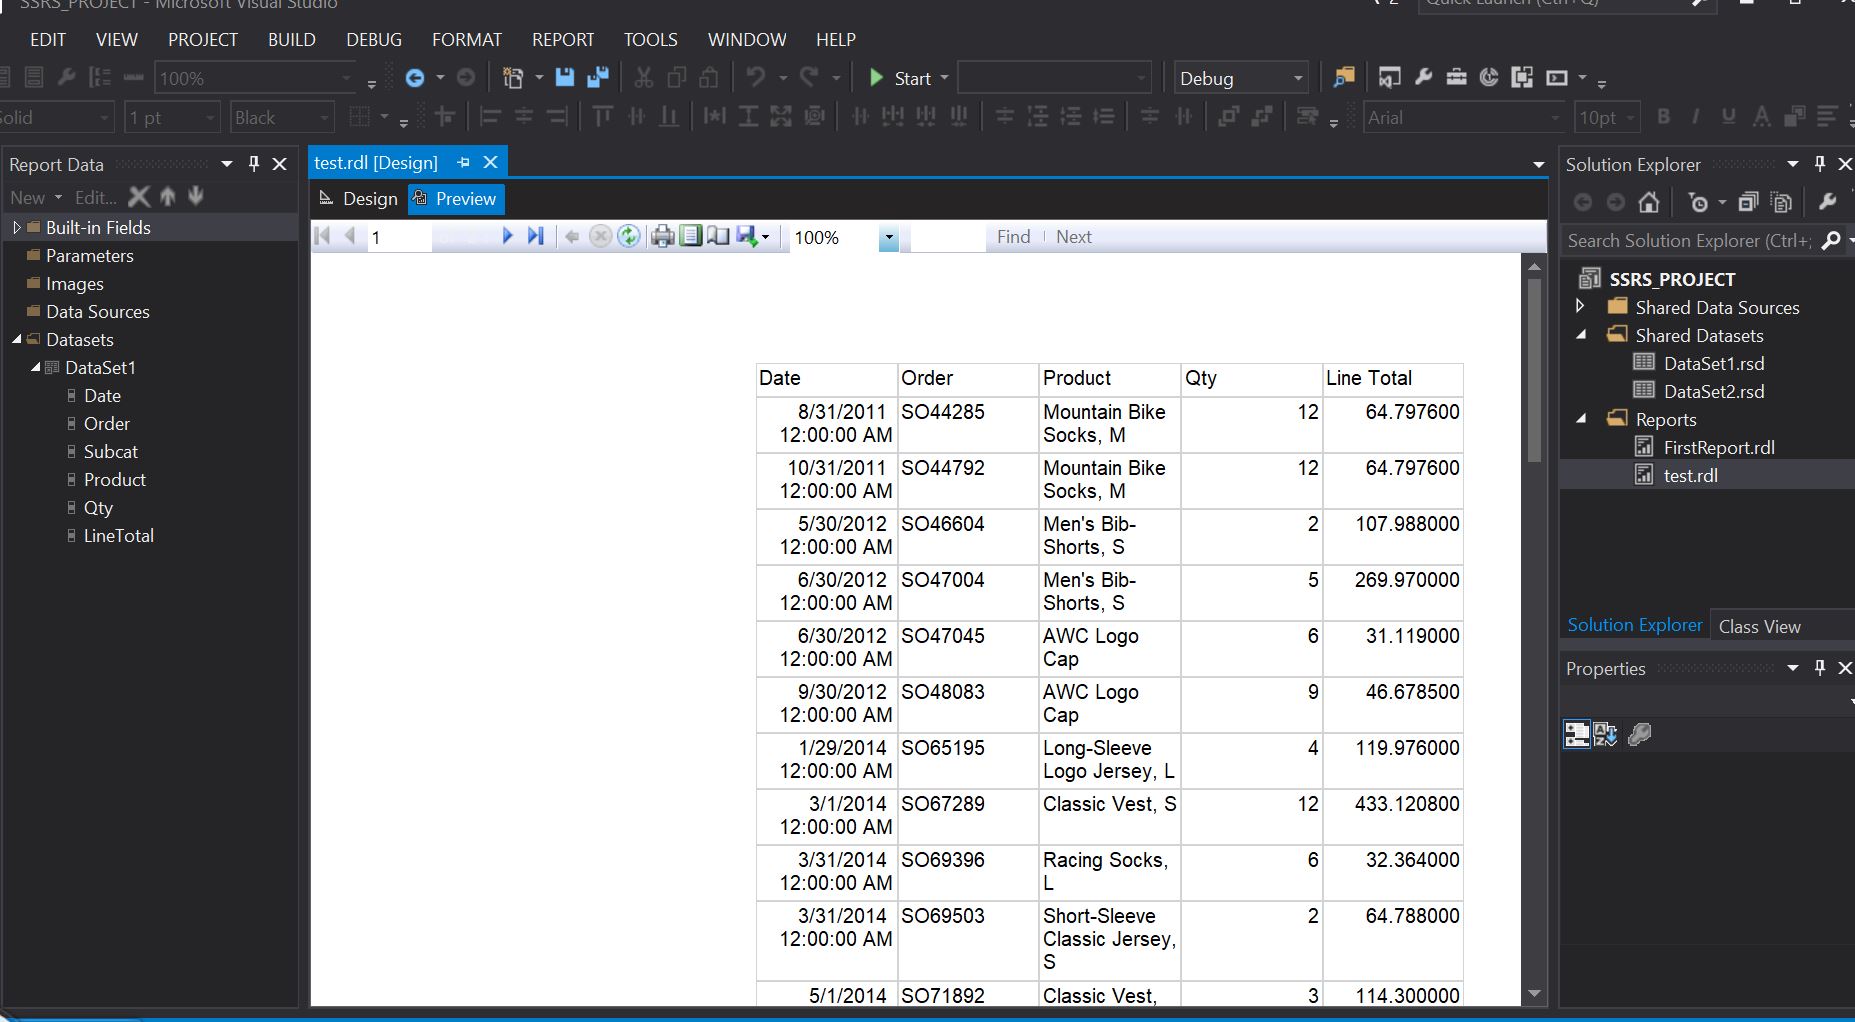
In the report data pane, expand the dataset to display all the fields, drag the 'date' field from the report data pane to the first column in the table, drag the 'Order' field from the report data pane to the second column in the table, drag the 'product' field from the report data pane to the third column in the table, Drag the 'Qty' field to the right edge of the third column until you get a vertical cursor and the mount pointer displays a [+] sign. When you release the mouse button, a fourth column is created for the 'Qty' field expression. Add the 'LineTotal' in the same way, creating a fifth column.
Previewing your report
Previewing your report enables you to view the rendered report without having to first publish it to a report server. It is necessary and important to preview your report frequently while designing it, by doing so, you validate the design and the data connections allowing you to correct errors as you go. To preview a report, select the preview tab. Report designer runs the report and displays it in the preview view.
Formatting a report
Now that we've added data region and some fields to the sales order report, let us format the date and currency fields and the column headers.
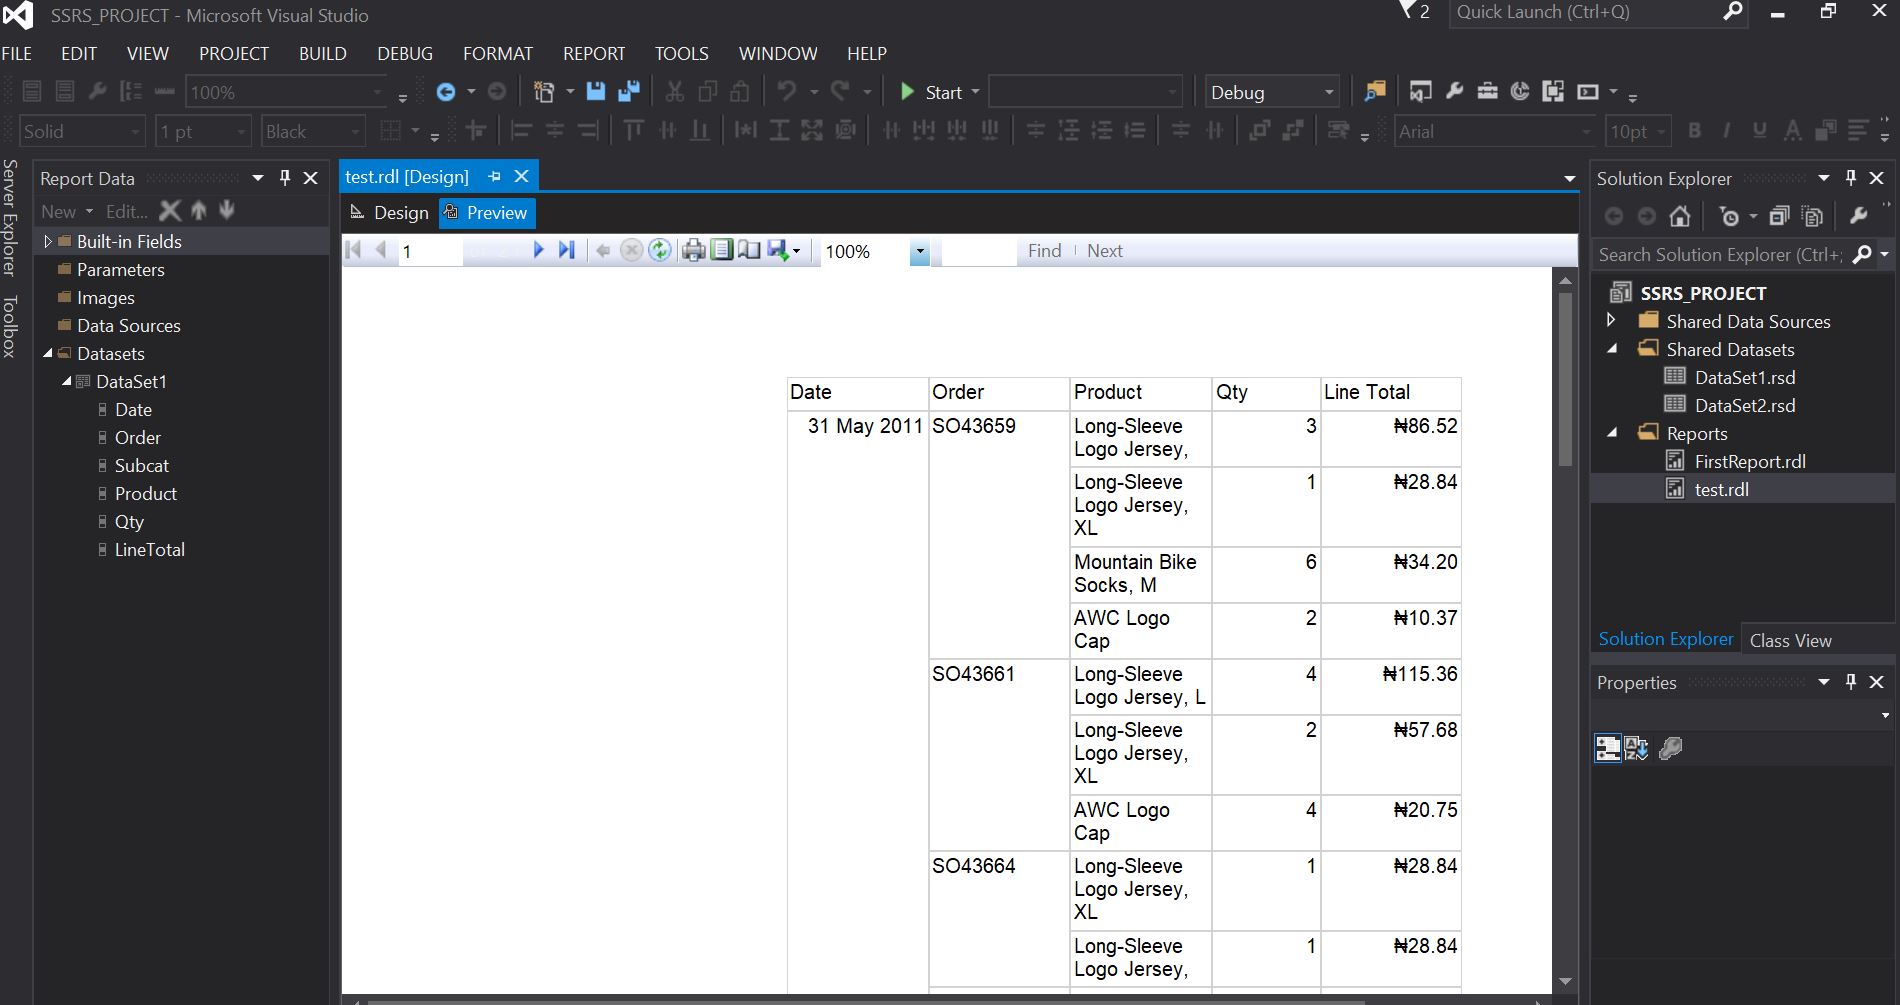
Formatting the date: The date field expression displays the date and time format by default, we can format it to display only the date. To do so, select the design tab, right click the cell with the date field expression and the select the text box properties. Select number and the in the category field, select date. In the type box, select January 31, 2020. Select Ok to apply the format. Preview the report to see the change to the Date field formatting.
Formatting the currency: The LineTotal field expression displays a general number, you can format it to display the number as currency. To do this, right click the cell with the LineTotal expression, and select Text box properties. Select Number in the left most column list box, and currency from the category list box. Use the 1000 separator (,), make every other change that you desire to and then select Ok to apply the format. Preview the report to see the changes done to the LineTotal expression column.
You can add other formatting to your report by highlighting the header row and adjusting the widths of the data columns.
To format the header row and table columns; select the table so that the column and row handles appear above and next o the table, then point to the line between the column handles so that the cursor changes into a double arrow. Drag the columns to the size you want.
From the file menu, select Save all to save the report.
Adding grouping and totals
As we round up, we are going to learn how to add grouping and totals to our reporting services report to organize and summarize our data.
To group data in a report
Select the Design tab. From the report data pane, drag the 'Date' field to the row group pane, place it above the row displayed as = (Details). If you don't see the row group pane, right click the design surface and select view > grouping. From the report data pane, drag the Order field to the row groups pane. Place it below date and above details. Delete the original Date and columns to the right of the double line. To format the new Date column, right click the data region cell that contains the date expression, and select text box properties. Select number in the left most column list box, and date from the category list box. In the type list box, select January 31, 2000; Select Ok to apply the format. Again preview the report, it should look as below:
Adding totals to a report
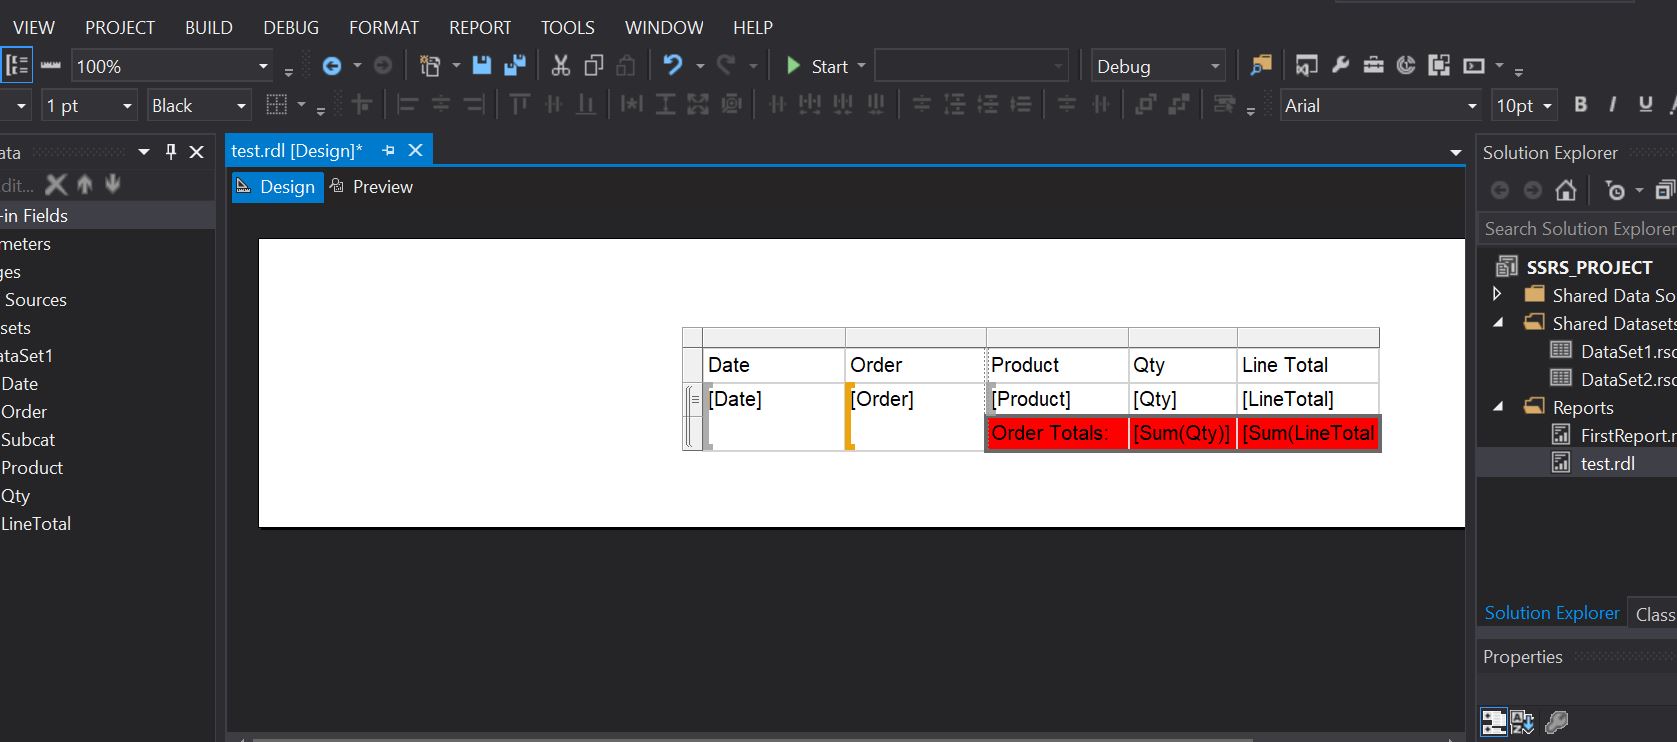
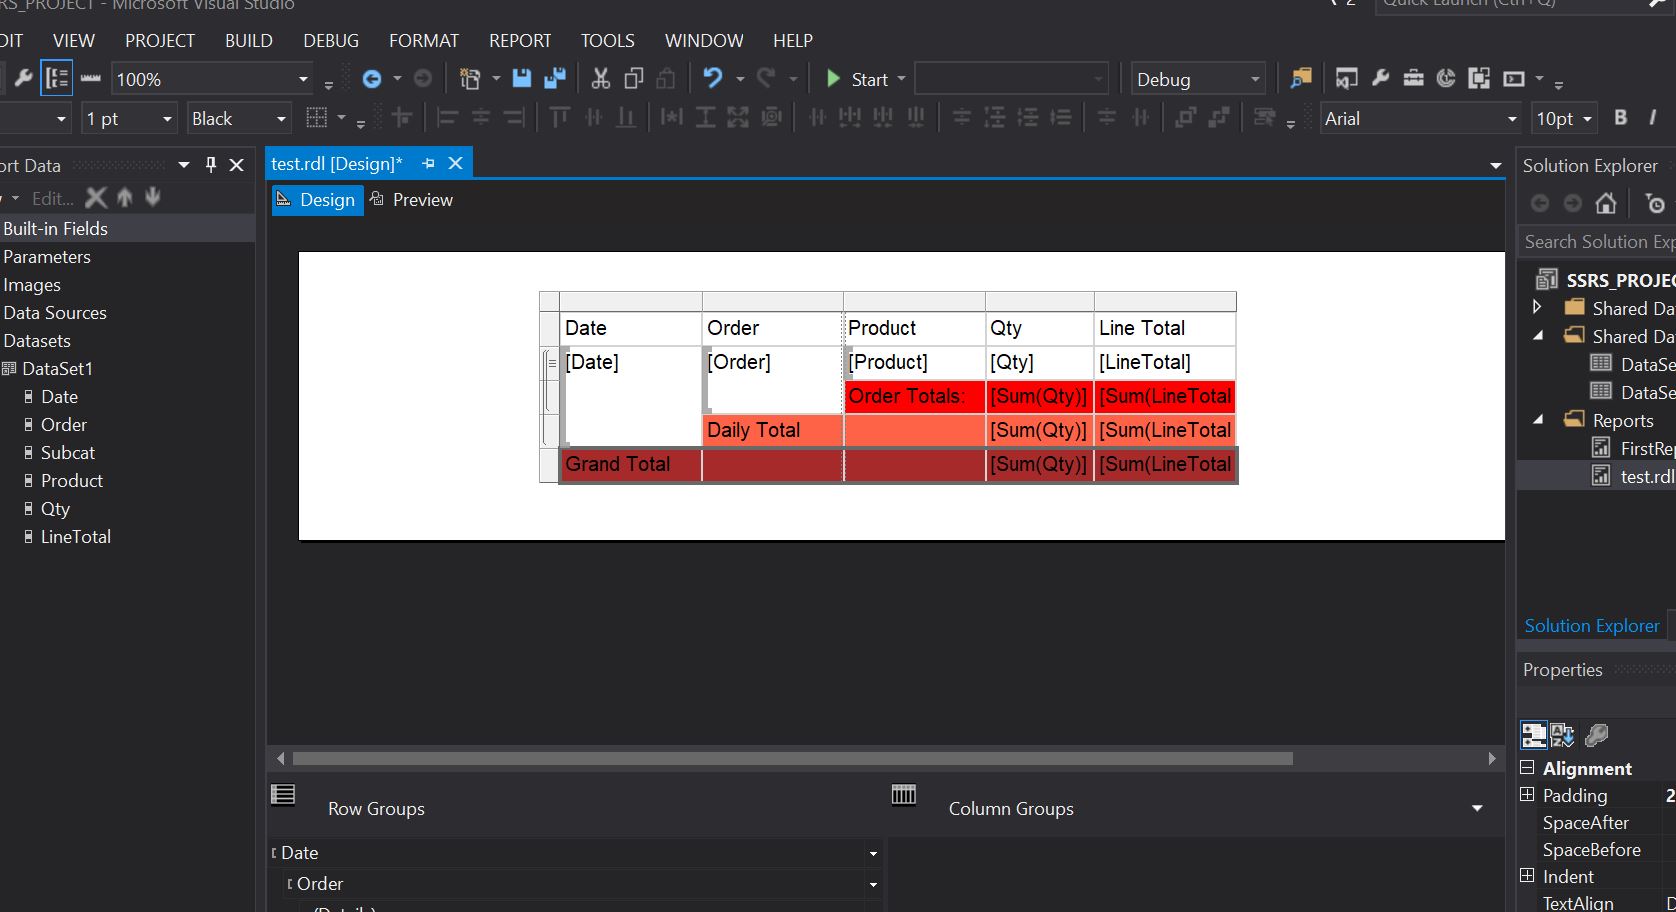
Switch to the design view, right click the data region cell that contains the LineTotal expression, and select Add total. Report designer adds a row with a sum of the dollar amount for each order. Right click the cell that contains the field Qty, and select Add total. Report designer should also add the sum of quantity for each order to the totals row.
In the empty cell to the left of the Sum[Qty] cell, type the string 'Order Totals'. You can add a background color to the totals row. Select the two sum cells and the label cells. From the format menu, select background color > your choice color square (I chose red for mine). Select Ok to apply the format.
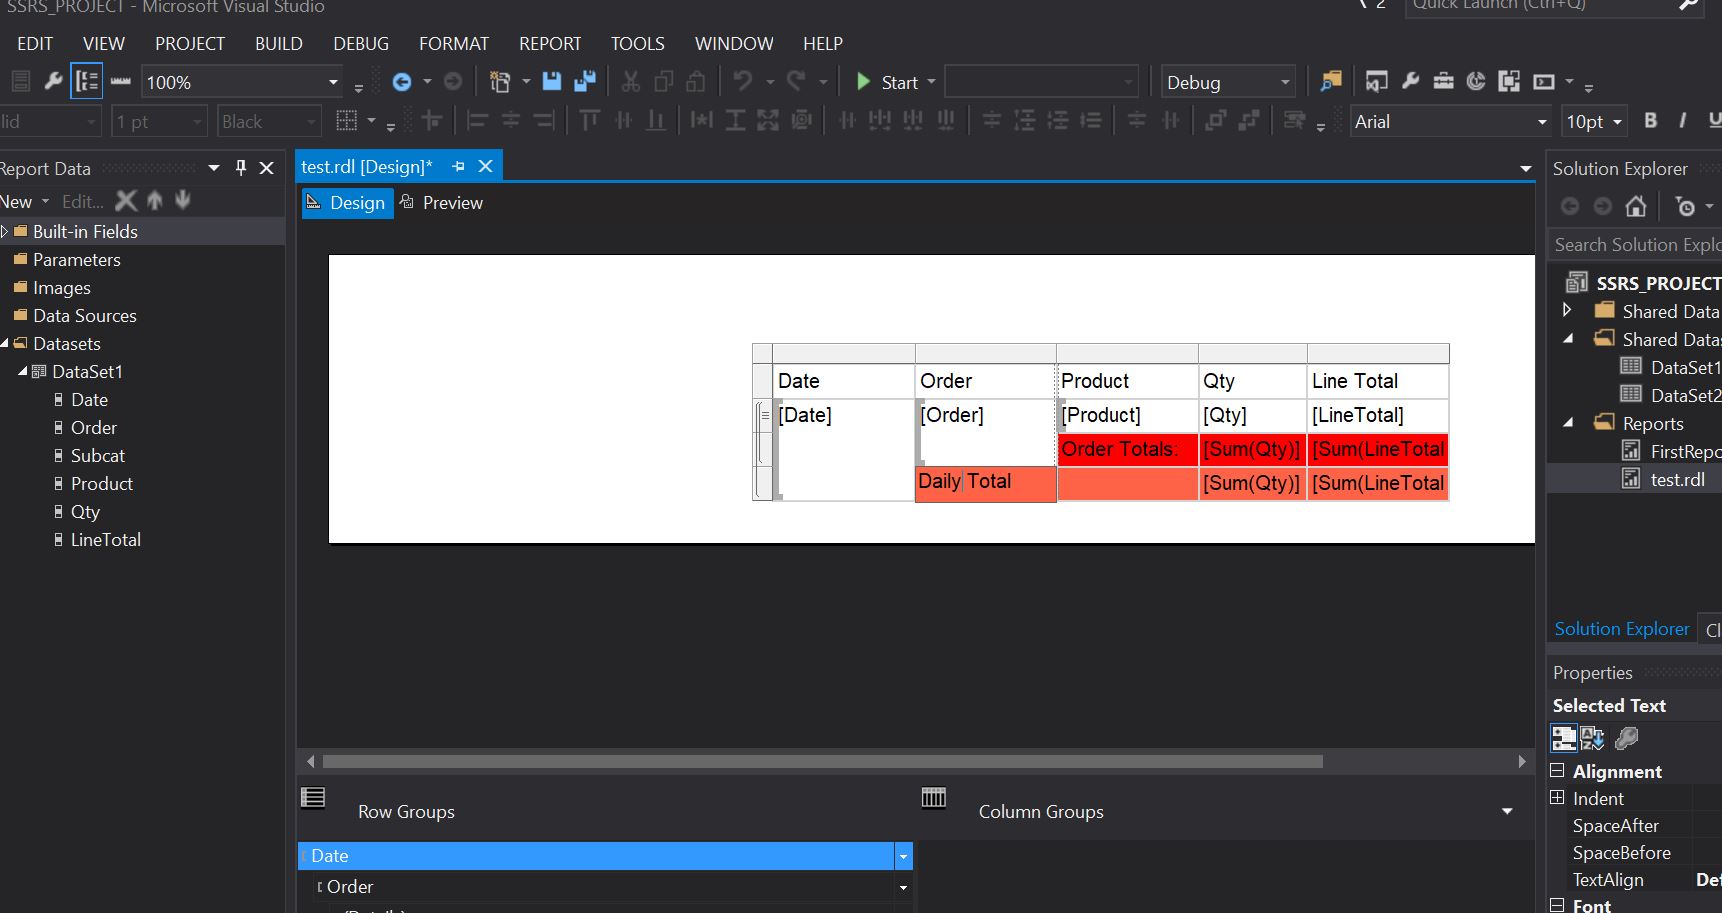
Add the daily total to the report
Right click the Order expression cell, and select Add total > After. Report Designer adds a new row containing sums of the Qty and LineTotal values for each day, and the string 'Total' to the bottom of the Order expression column. Type the word 'Daily' before the word 'Total' in the same cell, so it reads 'Daily total'. Select that cell and the two adjacent total cells to the right and the empty cell in between them. From the format menu, select background color > any color of your choice. Select Ok to apply the format.
Add the grand total to the report
Right click the Date expression cell, and select Add total > After. Report designer adds a new row containing sums of the Qty and LineTotal values for the entire report, and the string 'Total' to the bottom of the Date expression column. Type the string 'Grand' before the word 'Total' in the same cell, so it reads 'Grand total'. Select the cell with 'Grand Total', the two sum() expression cells and the empty cells between them, from the format menu, select Background color > Any other color of your choice. Select Ok to apply the format.
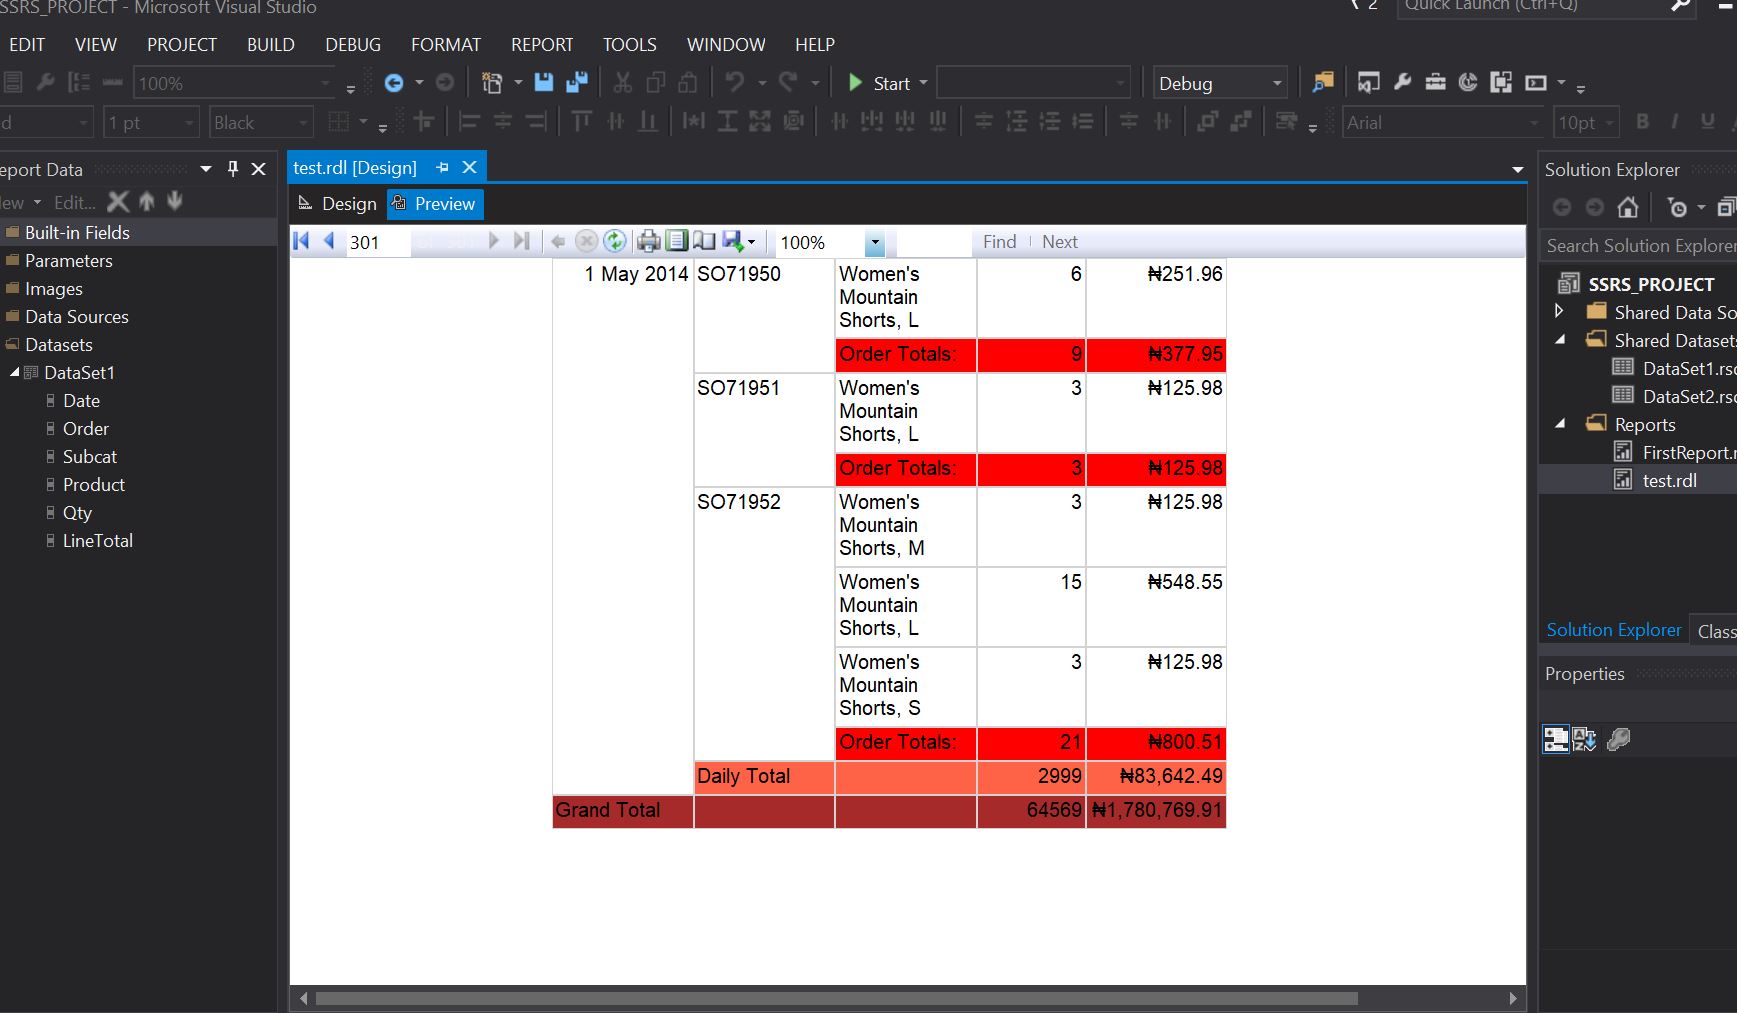
Preview the report by selecting the preview tab. In the preview toolbar, select the last page button, which shows the results as displayed below:

And we are done for this article, I know that was a lot to take in, but the good news is I would continue writing on SSRS in the coming weeks and in this case would be extensive and detailed, so do well to stay tuned.
Also, like and share the post, if you have any problem, kindly indicate it on the comment section, also you can reach me on Twitter or mail me directly.

